
 Yahoo Finance
 Do You Know What Valener Inc’s (TSE:VNR) P/E Ratio Means?

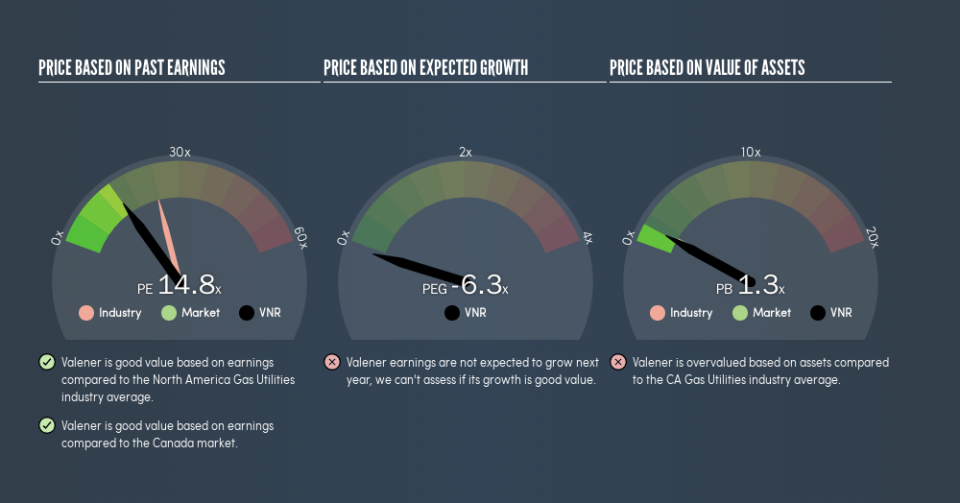
This article is written for those who want to get better at using price to earnings ratios (P/E ratios). We’ll look at Valener Inc’s (TSE:VNR) P/E ratio and reflect on what it tells us about the company’s share price. Valener has a price to earnings ratio of 14.77, based on the last twelve months. That means that at current prices, buyers pay CA$14.77 for every CA$1 in trailing yearly profits.
View our latest analysis for Valener
How Do You Calculate A P/E Ratio?
The formula for price to earnings is:
Price to Earnings Ratio = Price per Share ÷ Earnings per Share (EPS)
Or for Valener:
P/E of 14.77 = CA$22.79 ÷ CA$1.54 (Based on the year to December 2018.)
Is A High P/E Ratio Good?
A higher P/E ratio means that investors are paying a higher price for each CA$1 of company earnings. That is not a good or a bad thing per se, but a high P/E does imply buyers are optimistic about the future.
How Growth Rates Impact P/E Ratios
If earnings fall then in the future the ‘E’ will be lower. That means unless the share price falls, the P/E will increase in a few years. A higher P/E should indicate the stock is expensive relative to others — and that may encourage shareholders to sell.
It’s nice to see that Valener grew EPS by a stonking 38% in the last year. And it has bolstered its earnings per share by 4.8% per year over the last five years. So we’d generally expect it to have a relatively high P/E ratio. In contrast, EPS has decreased by 10%, annually, over 3 years.
How Does Valener’s P/E Ratio Compare To Its Peers?
We can get an indication of market expectations by looking at the P/E ratio. If you look at the image below, you can see Valener has a lower P/E than the average (23.9) in the gas utilities industry classification.
Valener’s P/E tells us that market participants think it will not fare as well as its peers in the same industry. While current expectations are low, the stock could be undervalued if the situation is better than the market assumes. You should delve deeper. I like to check if company insiders have been buying or selling.
Remember: P/E Ratios Don’t Consider The Balance Sheet
The ‘Price’ in P/E reflects the market capitalization of the company. That means it doesn’t take debt or cash into account. Hypothetically, a company could reduce its future P/E ratio by spending its cash (or taking on debt) to achieve higher earnings.
Such spending might be good or bad, overall, but the key point here is that you need to look at debt to understand the P/E ratio in context.
Is Debt Impacting Valener’s P/E?
Net debt totals just 9.2% of Valener’s market cap. It would probably trade on a higher P/E ratio if it had a lot of cash, but I doubt it is having a big impact.
The Verdict On Valener’s P/E Ratio
Valener trades on a P/E ratio of 14.8, which is fairly close to the CA market average of 14.9. Given it has reasonable debt levels, and grew earnings strongly last year, the P/E indicates the market has doubts this growth can be sustained.
Investors have an opportunity when market expectations about a stock are wrong. If the reality for a company is not as bad as the P/E ratio indicates, then the share price should increase as the market realizes this. So this free visual report on analyst forecasts could hold the key to an excellent investment decision.
Of course you might be able to find a better stock than Valener. So you may wish to see this free collection of other companies that have grown earnings strongly.
We aim to bring you long-term focused research analysis driven by fundamental data. Note that our analysis may not factor in the latest price-sensitive company announcements or qualitative material.
If you spot an error that warrants correction, please contact the editor at editorial-team@simplywallst.com. This article by Simply Wall St is general in nature. It does not constitute a recommendation to buy or sell any stock, and does not take account of your objectives, or your financial situation. Simply Wall St has no position in the stocks mentioned. Thank you for reading.
