
 Yahoo Finance
 Do You Know What RCS MediaGroup S.p.A.'s (BIT:RCS) P/E Ratio Means?

Today, we'll introduce the concept of the P/E ratio for those who are learning about investing. To keep it practical, we'll show how RCS MediaGroup S.p.A.'s (BIT:RCS) P/E ratio could help you assess the value on offer. RCS MediaGroup has a price to earnings ratio of 4.86, based on the last twelve months. That means that at current prices, buyers pay €4.86 for every €1 in trailing yearly profits.
View our latest analysis for RCS MediaGroup
How Do I Calculate A Price To Earnings Ratio?
The formula for P/E is:
Price to Earnings Ratio = Share Price ÷ Earnings per Share (EPS)
Or for RCS MediaGroup:
P/E of 4.86 = €0.643 ÷ €0.132 (Based on the trailing twelve months to March 2020.)
(Note: the above calculation results may not be precise due to rounding.)
Is A High Price-to-Earnings Ratio Good?
The higher the P/E ratio, the higher the price tag of a business, relative to its trailing earnings. That isn't necessarily good or bad, but a high P/E implies relatively high expectations of what a company can achieve in the future.
How Does RCS MediaGroup's P/E Ratio Compare To Its Peers?
The P/E ratio essentially measures market expectations of a company. We can see in the image below that the average P/E (13.9) for companies in the media industry is higher than RCS MediaGroup's P/E.
RCS MediaGroup's P/E tells us that market participants think it will not fare as well as its peers in the same industry. While current expectations are low, the stock could be undervalued if the situation is better than the market assumes. If you consider the stock interesting, further research is recommended. For example, I often monitor director buying and selling.
How Growth Rates Impact P/E Ratios
Generally speaking the rate of earnings growth has a profound impact on a company's P/E multiple. If earnings are growing quickly, then the 'E' in the equation will increase faster than it would otherwise. Therefore, even if you pay a high multiple of earnings now, that multiple will become lower in the future. So while a stock may look expensive based on past earnings, it could be cheap based on future earnings.
RCS MediaGroup shrunk earnings per share by 20% over the last year.
Remember: P/E Ratios Don't Consider The Balance Sheet
One drawback of using a P/E ratio is that it considers market capitalization, but not the balance sheet. That means it doesn't take debt or cash into account. Hypothetically, a company could reduce its future P/E ratio by spending its cash (or taking on debt) to achieve higher earnings.
Such spending might be good or bad, overall, but the key point here is that you need to look at debt to understand the P/E ratio in context.
So What Does RCS MediaGroup's Balance Sheet Tell Us?
Net debt is 25% of RCS MediaGroup's market cap. While it's worth keeping this in mind, it isn't a worry.
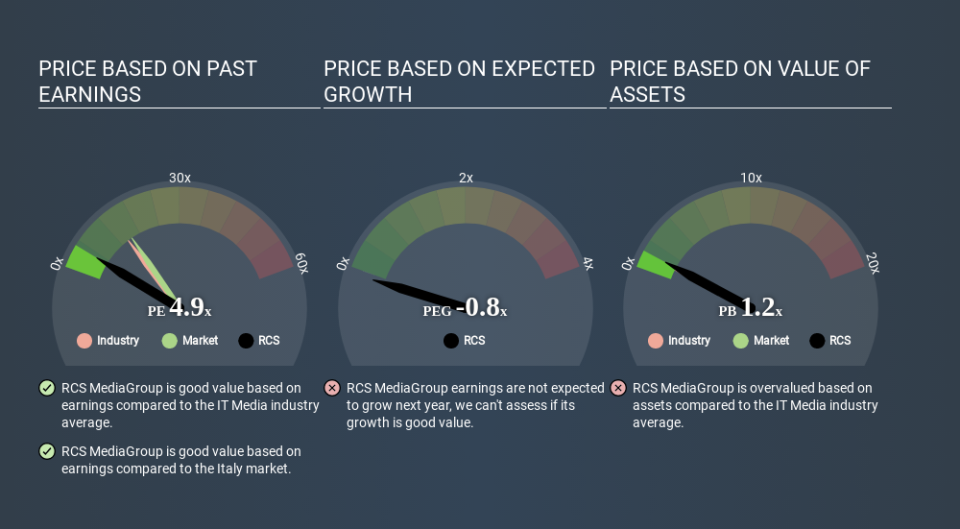
The Bottom Line On RCS MediaGroup's P/E Ratio
RCS MediaGroup's P/E is 4.9 which is below average (15.4) in the IT market. The debt levels are not a major concern, but the lack of EPS growth is likely weighing on sentiment.
When the market is wrong about a stock, it gives savvy investors an opportunity. If it is underestimating a company, investors can make money by buying and holding the shares until the market corrects itself. So this free visual report on analyst forecasts could hold the key to an excellent investment decision.
Of course you might be able to find a better stock than RCS MediaGroup. So you may wish to see this free collection of other companies that have grown earnings strongly.
Love or hate this article? Concerned about the content? Get in touch with us directly. Alternatively, email editorial-team@simplywallst.com.
This article by Simply Wall St is general in nature. It does not constitute a recommendation to buy or sell any stock, and does not take account of your objectives, or your financial situation. We aim to bring you long-term focused analysis driven by fundamental data. Note that our analysis may not factor in the latest price-sensitive company announcements or qualitative material. Simply Wall St has no position in any stocks mentioned. Thank you for reading.
