
 Yahoo Finance
 What You Should Know About Hanwei Energy Services Corp.'s (TSE:HE) Financial Strength

Want to participate in a short research study? Help shape the future of investing tools and you could win a $250 gift card!
Investors are always looking for growth in small-cap stocks like Hanwei Energy Services Corp. (TSE:HE), with a market cap of CA$3.9m. However, an important fact which most ignore is: how financially healthy is the business? Given that HE is not presently profitable, it’s crucial to understand the current state of its operations and pathway to profitability. The following basic checks can help you get a picture of the company's balance sheet strength. Nevertheless, these checks don't give you a full picture, so I recommend you dig deeper yourself into HE here.
Does HE Produce Much Cash Relative To Its Debt?
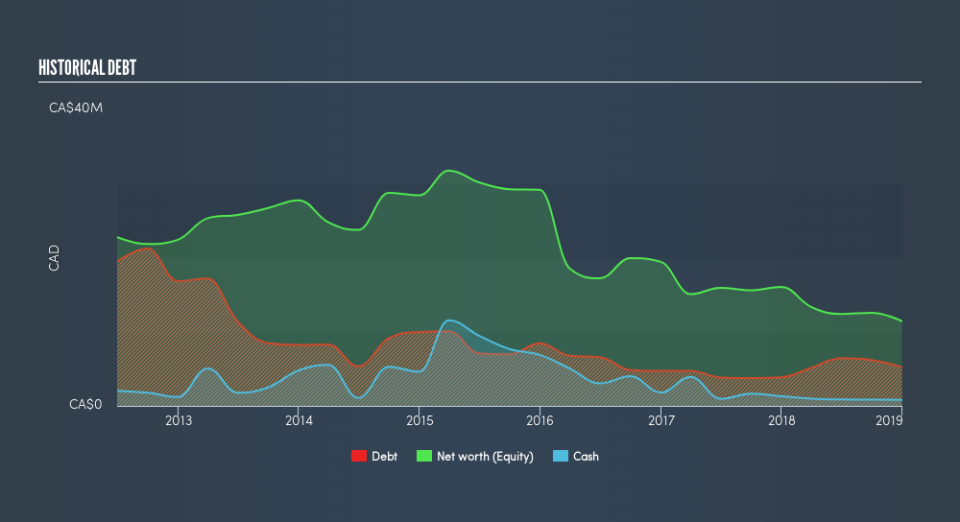
HE's debt levels surged from CA$3.9m to CA$5.2m over the last 12 months , which is mainly comprised of near term debt. With this growth in debt, HE's cash and short-term investments stands at CA$797k , ready to be used for running the business. Moreover, HE has generated cash from operations of CA$2.9m over the same time period, resulting in an operating cash to total debt ratio of 56%, meaning that HE’s debt is appropriately covered by operating cash.
Can HE pay its short-term liabilities?
With current liabilities at CA$28m, it seems that the business arguably has a rather low level of current assets relative its obligations, with the current ratio last standing at 0.3x. The current ratio is calculated by dividing current assets by current liabilities.
Is HE’s debt level acceptable?
With a debt-to-equity ratio of 46%, HE can be considered as an above-average leveraged company. This is somewhat unusual for small-caps companies, since lenders are often hesitant to provide attractive interest rates to less-established businesses. But since HE is presently unprofitable, sustainability of its current state of operations becomes a concern. Maintaining a high level of debt, while revenues are still below costs, can be dangerous as liquidity tends to dry up in unexpected downturns.
Next Steps:
HE’s high cash coverage means that, although its debt levels are high, the company is able to utilise its borrowings efficiently in order to generate cash flow. But, its low liquidity raises concerns over whether current asset management practices are properly implemented for the small-cap. Keep in mind I haven't considered other factors such as how HE has been performing in the past. I recommend you continue to research Hanwei Energy Services to get a more holistic view of the stock by looking at:
Historical Performance: What has HE's returns been like over the past? Go into more detail in the past track record analysis and take a look at the free visual representations of our analysis for more clarity.
Other High-Performing Stocks: Are there other stocks that provide better prospects with proven track records? Explore our free list of these great stocks here.
We aim to bring you long-term focused research analysis driven by fundamental data. Note that our analysis may not factor in the latest price-sensitive company announcements or qualitative material.
If you spot an error that warrants correction, please contact the editor at editorial-team@simplywallst.com. This article by Simply Wall St is general in nature. It does not constitute a recommendation to buy or sell any stock, and does not take account of your objectives, or your financial situation. Simply Wall St has no position in the stocks mentioned. Thank you for reading.