
 Yahoo Finance
 What You Should Know About The Bank of Nova Scotia’s (TSE:BNS) Risks

As a CA$95.94b market capitalisation company operating in the financial services sector, The Bank of Nova Scotia (TSE:BNS) has benefited from strong economic growth and improved credit quality as a result of post-GFC recovery. A borrower’s demand for, and ability to repay, loans is driven by economic growth which directly impacts the level of risk Bank of Nova Scotia takes on. With stricter regulations as a result of the GFC, banks are more conservative in their lending practices, leading to more prudent levels of risky assets on the balance sheet. Since the level of risky assets held by a bank impacts its cash flow and therefore the attractiveness of its stock as an investment, I will take you through three metrics that are insightful proxies for risk.
See our latest analysis for Bank of Nova Scotia
How Much Risk Is Too Much?
Bank of Nova Scotia’s operations expose it to risky assets by lending to borrowers who may not be able to repay their loans. Typically, loans that are “bad” and cannot be recuperated by the bank should comprise less than 3% of its total loans. When these loans are not repaid, they are written off as expenses which comes directly out of the bank’s profit. Since bad loans make up a relatively small 0.98% of total assets, the bank exhibits strict bad debt management and faces low risk of default.
Does Bank of Nova Scotia Understand Its Own Risks?
Bank of Nova Scotia’s ability to forecast and provision for its bad loans relatively accurately indicates it has a good understanding of the level of risk it is taking on. If it writes off more than 100% of the bad debt it provisioned for, then it has poorly anticipated the factors that may have contributed to a higher bad loan level which begs the question – does Bank of Nova Scotia understand its own risk?. Bank of Nova Scotia’s low bad loan to bad debt ratio of 96.14% means the bank has under-provisioned by -3.86%, indicating either an unexpected one-off occurence with defaults or poor bad debt provisioning.
How Big Is Bank of Nova Scotia’s Safety Net?

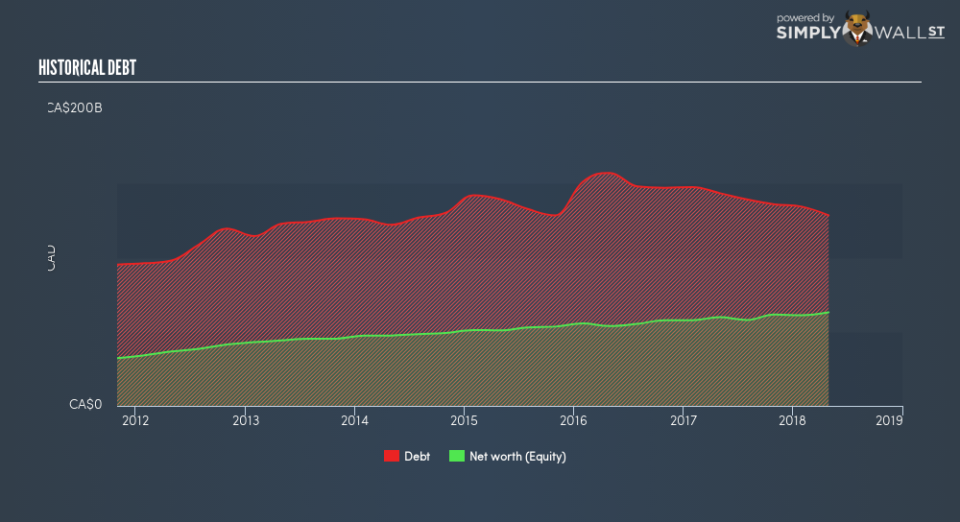
Bank of Nova Scotia profits from lending out its various forms of borrowings and charging interest rates. Deposits from customers tend to carry the lowest risk due to the relatively stable interest rate and amount available. As a rule, a bank is considered less risky if it holds a higher level of deposits. Since Bank of Nova Scotia’s total deposit to total liabilities is within the sensible margin at 75.0% compared to other banks’ level of 50%, it shows a prudent level of the bank’s safer form of borrowing and an appropriate level of risk.
Next Steps:
How will BNS’s recent acquisition impact the business going forward? Should you be concerned about the future of BNS and the sustainability of its financial health? Below, I’ve listed three fundamental areas on Simply Wall St’s dashboard for a quick visualization on current trends for BNS. I’ve also used this site as a source of data for my article.
Future Outlook: What are well-informed industry analysts predicting for BNS’s future growth? Take a look at our free research report of analyst consensus for BNS’s outlook.
Valuation: What is BNS worth today? Has the future growth potential already been factored into the price? The intrinsic value infographic in our free research report helps visualize whether BNS is currently mispriced by the market.
Other High-Performing Stocks: Are there other stocks that provide better prospects with proven track records? Explore our free list of these great stocks here.
To help readers see past the short term volatility of the financial market, we aim to bring you a long-term focused research analysis purely driven by fundamental data. Note that our analysis does not factor in the latest price-sensitive company announcements.
The author is an independent contributor and at the time of publication had no position in the stocks mentioned. For errors that warrant correction please contact the editor at editorial-team@simplywallst.com.
