
 Yahoo Finance
 Knight Therapeutics (TSE:GUD) shareholders have endured a 21% loss from investing in the stock five years ago
For many, the main point of investing is to generate higher returns than the overall market. But even the best stock picker will only win with some selections. So we wouldn't blame long term Knight Therapeutics Inc. (TSE:GUD) shareholders for doubting their decision to hold, with the stock down 21% over a half decade. In contrast, the stock price has popped 9.4% in the last thirty days.
It's worthwhile assessing if the company's economics have been moving in lockstep with these underwhelming shareholder returns, or if there is some disparity between the two. So let's do just that.
Check out our latest analysis for Knight Therapeutics
Knight Therapeutics isn't currently profitable, so most analysts would look to revenue growth to get an idea of how fast the underlying business is growing. When a company doesn't make profits, we'd generally hope to see good revenue growth. As you can imagine, fast revenue growth, when maintained, often leads to fast profit growth.
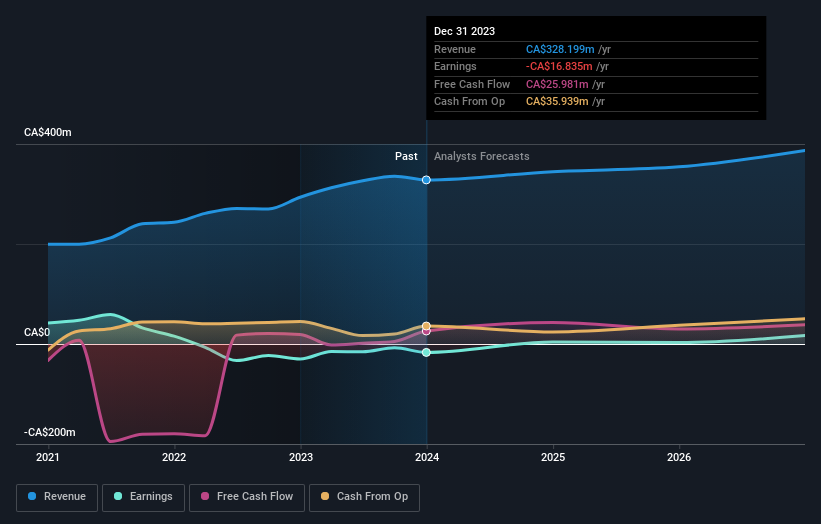
Over five years, Knight Therapeutics grew its revenue at 38% per year. That's well above most other pre-profit companies. Shareholders are no doubt disappointed with the loss of 4%, each year, in that time. You could say that the market has been harsh, given the top line growth. So now is probably an apt time to look closer at the stock, if you think it has potential.
You can see how earnings and revenue have changed over time in the image below (click on the chart to see the exact values).
We consider it positive that insiders have made significant purchases in the last year. Having said that, most people consider earnings and revenue growth trends to be a more meaningful guide to the business. So we recommend checking out this free report showing consensus forecasts
A Different Perspective
It's nice to see that Knight Therapeutics shareholders have received a total shareholder return of 19% over the last year. Notably the five-year annualised TSR loss of 4% per year compares very unfavourably with the recent share price performance. The long term loss makes us cautious, but the short term TSR gain certainly hints at a brighter future. Investors who like to make money usually check up on insider purchases, such as the price paid, and total amount bought. You can find out about the insider purchases of Knight Therapeutics by clicking this link.
There are plenty of other companies that have insiders buying up shares. You probably do not want to miss this free list of growing companies that insiders are buying.
Please note, the market returns quoted in this article reflect the market weighted average returns of stocks that currently trade on Canadian exchanges.
Have feedback on this article? Concerned about the content? Get in touch with us directly. Alternatively, email editorial-team (at) simplywallst.com.
This article by Simply Wall St is general in nature. We provide commentary based on historical data and analyst forecasts only using an unbiased methodology and our articles are not intended to be financial advice. It does not constitute a recommendation to buy or sell any stock, and does not take account of your objectives, or your financial situation. We aim to bring you long-term focused analysis driven by fundamental data. Note that our analysis may not factor in the latest price-sensitive company announcements or qualitative material. Simply Wall St has no position in any stocks mentioned.
