
 Yahoo Finance
 KLA (NASDAQ:KLAC) Knows How To Allocate Capital Effectively
If we want to find a potential multi-bagger, often there are underlying trends that can provide clues. Firstly, we'd want to identify a growing return on capital employed (ROCE) and then alongside that, an ever-increasing base of capital employed. Ultimately, this demonstrates that it's a business that is reinvesting profits at increasing rates of return. And in light of that, the trends we're seeing at KLA's (NASDAQ:KLAC) look very promising so lets take a look.
What Is Return On Capital Employed (ROCE)?
For those who don't know, ROCE is a measure of a company's yearly pre-tax profit (its return), relative to the capital employed in the business. The formula for this calculation on KLA is:
Return on Capital Employed = Earnings Before Interest and Tax (EBIT) ÷ (Total Assets - Current Liabilities)
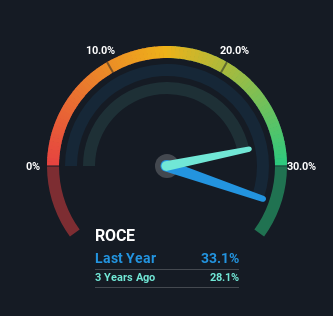
0.33 = US$3.5b ÷ (US$15b - US$4.5b) (Based on the trailing twelve months to March 2024).
Thus, KLA has an ROCE of 33%. That's a fantastic return and not only that, it outpaces the average of 9.5% earned by companies in a similar industry.
View our latest analysis for KLA
Above you can see how the current ROCE for KLA compares to its prior returns on capital, but there's only so much you can tell from the past. If you'd like to see what analysts are forecasting going forward, you should check out our free analyst report for KLA .
What Does the ROCE Trend For KLA Tell Us?
Investors would be pleased with what's happening at KLA. The numbers show that in the last five years, the returns generated on capital employed have grown considerably to 33%. The company is effectively making more money per dollar of capital used, and it's worth noting that the amount of capital has increased too, by 40%. The increasing returns on a growing amount of capital is common amongst multi-baggers and that's why we're impressed.
For the record though, there was a noticeable increase in the company's current liabilities over the period, so we would attribute some of the ROCE growth to that. The current liabilities has increased to 30% of total assets, so the business is now more funded by the likes of its suppliers or short-term creditors. Keep an eye out for future increases because when the ratio of current liabilities to total assets gets particularly high, this can introduce some new risks for the business.
In Conclusion...
A company that is growing its returns on capital and can consistently reinvest in itself is a highly sought after trait, and that's what KLA has. And a remarkable 640% total return over the last five years tells us that investors are expecting more good things to come in the future. Therefore, we think it would be worth your time to check if these trends are going to continue.
Like most companies, KLA does come with some risks, and we've found 1 warning sign that you should be aware of.
KLA is not the only stock earning high returns. If you'd like to see more, check out our free list of companies earning high returns on equity with solid fundamentals.
Have feedback on this article? Concerned about the content? Get in touch with us directly. Alternatively, email editorial-team (at) simplywallst.com.
This article by Simply Wall St is general in nature. We provide commentary based on historical data and analyst forecasts only using an unbiased methodology and our articles are not intended to be financial advice. It does not constitute a recommendation to buy or sell any stock, and does not take account of your objectives, or your financial situation. We aim to bring you long-term focused analysis driven by fundamental data. Note that our analysis may not factor in the latest price-sensitive company announcements or qualitative material. Simply Wall St has no position in any stocks mentioned.
Have feedback on this article? Concerned about the content? Get in touch with us directly. Alternatively, email editorial-team@simplywallst.com
