
 Yahoo Finance
 Kinross reports 2022 third-quarter results

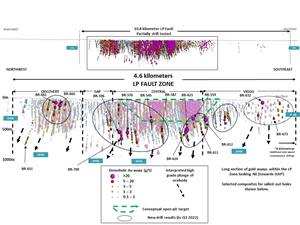
Appendix B: LP Fault zone long section
Appendix C: LP grade thickness long section demonstrating depth extension potential

Company reports increased quarterly production and lower costs
Returned capital of approximately $300 million year-to-date
TORONTO, Nov. 09, 2022 (GLOBE NEWSWIRE) -- Kinross Gold Corporation (TSX: K, NYSE: KGC) (“Kinross” or the “Company”) today announced its results for the third-quarter ended September 30, 2022.
This news release contains forward-looking information about expected future events and financial and operating performance of the Company. Please refer to the risks and assumptions set out in our Cautionary Statement on Forward-Looking Information located on page 30 of this release. All dollar amounts are expressed in U.S. dollars, unless otherwise noted.
Results from the Company’s Russian and Ghanaian assets have been excluded from its Q3 2022 continuing results, along with comparative figures, due to the classification of these assets as discontinued as at September 30, 2022.
Q3 2022 highlights from continuing operations:
Gold equivalent production of 529,155 Au eq. oz. produced, an increase of 17% compared with Q2.
Production cost of sales1 of $941 per Au eq. oz. sold and all-in sustaining cost2 of $1,282 per Au eq. oz. sold, representing reductions of 8% and 4%, respectively, compared with Q2.
Margins3 of $791 per Au eq. oz. sold.
Operating cash flow4 of $173.2 million and adjusted operating cash flow2 of $259.4 million.
Reported net earnings5 of $65.9 million, or $0.05 per share, with adjusted net earnings2, 6 of $68.7 million, or $0.05 per share2.
Cash and cash equivalents of $488.4 million, and total liquidity7 of approximately $2 billion at September 30, 2022.
Return of capital:
Kinross returned approximately $300 million of capital to its shareholders year-to-date through its enhanced share buyback and quarterly dividend programs, or approximately $0.23 per share. Full year return of capital is expected to be approximately $450 million.
Since launching an enhanced share buyback program in September, the Company has re-purchased approximately $180 million in shares, or 60%, out of the $300 million planned for 2022.
Kinross’ Board of Directors declared a quarterly dividend of $0.03 per common share payable on December 15, 2022 to shareholders of record at the close of business on December 1, 2022.
________________________
1 “Production cost of sales from continuing operations per equivalent ounce sold” is defined as production cost of sales, as reported on the interim condensed consolidated statements of operations, divided by total gold equivalent ounces sold from continuing operations.
2 These figures are non-GAAP financial measures and ratios, as applicable, and are defined and reconciled on pages 18 to 23 of this news release. Non-GAAP financial measures and ratios have no standardized meaning under IFRS and therefore, may not be comparable to similar measures presented by other issuers.
3 “Margins” from continuing operations per equivalent ounce sold is defined as average realized gold price per ounce from continuing operations less production cost of sales from continuing operations per equivalent ounce sold.
4 Operating cash flow figures in this release represent “Net cash flow of continuing operations provided from operating activities,” as reported on the interim condensed consolidated statements of cash flows.
5 Reported net earnings (loss) figures in this news release represent “Net earnings (loss) from continuing operations attributable to common shareholders,” as reported on the interim condensed consolidated statements of operations.
6 Adjusted net earnings figures in this news release represent “Adjusted net earnings from continuing operations attributable to common shareholders.”
7 “Total liquidity” is defined as the sum of cash and cash equivalents, as reported on the interim condensed consolidated balance sheets, and available credit under the Company’s credit facilities (as calculated in Section 6 – Liquidity and Capital Resources of Kinross’ MD&A for the three and nine months ended September 30, 2022).
Company guidance:
Kinross is expecting its 2022 production to be approximately 2 million Au eq. oz., mainly due to the temporary delays in La Coipa’s mill ramp-up and commissioning related to the Tasiast 21k project. Full-year production from continuing operations for the year ended December 31, 2021 was 1,447,240 Au eq. oz.
The Company expects its 2022 production cost of sales to be slightly above $900 per Au eq. oz. All-in sustaining cost is expected to be approximately $1,240 per Au eq. oz. sold2. Consolidated production cost of sales was $8328 per Au eq. oz. sold and attributable all-in sustaining cost of sales was $1,1382, 8 per Au eq. oz. sold for the year ended December 31, 2021.
The Company now anticipates its 2022 capital expenditures to be approximately $750 million mainly due to deferred capital development across the portfolio. Capital expenditures from continuing operations were $822 million for the year ended December 31, 2021.
Kinross has updated its forecast to produce approximately 2.1 million attributable9 Au eq. oz. in 2023 and 2024, respectively, and approximately 2 million attributable9 Au eq. oz. in 2025.
Development projects:
The Great Bear project in Red Lake, Ontario, continues to make excellent progress and the Company plans to declare an initial mineral resource estimate in early 2023. Drilling results continue to confirm Kinross’ vision of developing a large, long-life mining complex.
The Tasiast 24k project is on schedule to reach 24,000 tonnes per day throughput in mid-2023.
The Manh Choh project advanced well during the quarter with production expected in the second half of 2024.
CEO Commentary:
J. Paul Rollinson, President and CEO, made the following comments in relation to 2022 third-quarter results:
“During the quarter, our operations increased production and lowered costs, primarily driven by higher grades at Paracatu, enhanced seasonal recoveries from our U.S.-based heap leaches, and the ramp-up at La Coipa, which progressed well and is expected to continue trending upwards with the mill averaging throughput levels of approximately 9,500 tonnes per day in October. Tasiast is on track to significantly increase production in the fourth quarter, with higher recoveries and increased throughput, which is expected to contribute to our strongest quarter of 2022.
“We are excited about our pipeline of development and exploration projects, which all made strong progress during the quarter. At the world-class Great Bear project, drilling results continue to fulfill our expectations, including high-grade intercepts at depth, and we are on track to declare an initial mineral resource early next year.
“We have returned approximately $300 million of capital to shareholders so far this year and expect to return a total of approximately $450 million by year-end through our share repurchase and dividend programs. Since launching our enhanced share buyback program in September, we have spent $180 million, effectively repurchasing for cancellation the shares that were issued as part of the Great Bear transaction while maintaining our quarterly dividend and investment-grade balance sheet.
“During the quarter we continued to advance our ESG goals. On climate change and emissions reductions, we have completed an analysis of climate-related scenarios and their potential impacts on our future business, advanced our pipeline of energy-efficiency projects, and entered into strategic partnerships with various technology providers, suppliers and electric utilities.”
________________________
8 Results as previously reported for the year ended December 31, 2021 include Ghanaian and Russian operations. Production cost of sales per equivalent ounce sold for the year ended December 31, 2021 is “Consolidated production cost of sales per equivalent ounce sold” and is defined as production cost of sales, as reported on the consolidated statements of operations for the year ended December 31, 2021, divided by total gold equivalent ounces sold. Attributable all-in sustaining cost per equivalent ounce sold of $1,138 for the year ended December 31, 2021 includes Kinross' share of Chirano (90%) production and costs. The definition and reconciliation of this non-GAAP ratio is included on page 20 of this news release.
9 Attributable production guidance includes Kinross' share of Manh Choh (70%) production.
Summary of financial and operating results
| Three months ended | Nine months ended | |||||||||
| September 30, | September 30, | |||||||||
(unaudited, in millions of U.S. dollars, except ounces, per share amounts, and per ounce amounts) |
| 2022 |
|
| 2021 |
|
| 2022 |
| 2021 |
|
Operating Highlights |
|
|
|
| |||||||
Total gold equivalent ounces(a) |
|
|
|
| |||||||
Produced(c) |
| 542,677 |
|
| 486,819 |
|
| 1,612,770 |
| 1,591,939 |
|
Sold(c) |
| 509,431 |
|
| 481,959 |
|
| 1,517,337 |
| 1,586,028 |
|
|
|
|
|
| |||||||
Total gold equivalent ounces from continuing operations(g) |
|
|
|
| |||||||
Produced(c) |
| 529,155 |
|
| 328,409 |
|
| 1,361,554 |
| 1,106,903 |
|
Sold(c) |
| 494,413 |
|
| 325,162 |
|
| 1,307,219 |
| 1,104,293 |
|
|
|
|
|
| |||||||
Attributable gold equivalent ounces(a) |
|
|
|
| |||||||
Produced(c) |
| 541,325 |
|
| 483,060 |
|
| 1,604,564 |
| 1,579,928 |
|
Sold(c) |
| 507,930 |
|
| 478,459 |
|
| 1,508,555 |
| 1,574,362 |
|
|
|
|
|
| |||||||
Financial Highlights from Continuing Operations(g) |
|
|
|
| |||||||
Metal sales | $ | 856.5 |
| $ | 582.4 |
| $ | 2,378.9 | $ | 1,984.7 |
|
Production cost of sales | $ | 465.3 |
| $ | 289.8 |
| $ | 1,279.2 | $ | 914.0 |
|
Depreciation, depletion and amortization | $ | 185.1 |
| $ | 173.2 |
| $ | 532.1 | $ | 530.3 |
|
Operating earnings (loss) | $ | 111.3 |
| $ | (23.7 | ) | $ | 277.8 | $ | 209.8 |
|
Net earnings (loss) from continuing operations attributable to common shareholders | $ | 65.9 |
| $ | (72.9 | ) | $ | 137.9 | $ | 36.3 |
|
Basic earnings (loss) per share from continuing operations attributable to common shareholders | $ | 0.05 |
| $ | (0.06 | ) | $ | 0.11 | $ | 0.03 |
|
Diluted earnings (loss) per share from continuing operations attributable to common shareholders | $ | 0.05 |
| $ | (0.06 | ) | $ | 0.11 | $ | 0.03 |
|
Adjusted net earnings from continuing operations attributable to common shareholders(b) | $ | 68.7 |
| $ | 11.2 |
| $ | 174.9 | $ | 183.4 |
|
Adjusted net earnings from continuing operations per share(b) | $ | 0.05 |
| $ | 0.01 |
| $ | 0.14 | $ | 0.15 |
|
Net cash flow of continuing operations provided from operating activities | $ | 173.2 |
| $ | 140.3 |
| $ | 528.2 | $ | 547.1 |
|
Adjusted operating cash flow from continuing operations(b) | $ | 259.4 |
| $ | 141.3 |
| $ | 760.4 | $ | 671.7 |
|
Capital expenditures from continuing operations(d) | $ | 197.3 |
| $ | 203.8 |
| $ | 447.4 | $ | 566.0 |
|
Free cash flow from continuing operations(b) | $ | (24.1 | ) | $ | (63.5 | ) | $ | 80.8 | $ | (18.9 | ) |
Average realized gold price per ounce from continuing operations(e) | $ | 1,732 |
| $ | 1,792 |
| $ | 1,821 | $ | 1,797 |
|
Production cost of sales from continuing operations per equivalent ounce(c) sold(f) | $ | 941 |
| $ | 891 |
| $ | 979 | $ | 828 |
|
Production cost of sales from continuing operations per ounce sold on a by-product basis(b) | $ | 919 |
| $ | 881 |
| $ | 966 | $ | 818 |
|
All-in sustaining cost from continuing operations per ounce sold on a by-product basis(b) | $ | 1,269 |
| $ | 1,365 |
| $ | 1,279 | $ | 1,162 |
|
All-in sustaining cost from continuing operations per equivalent ounce(c) sold(b) | $ | 1,282 |
| $ | 1,369 |
| $ | 1,287 | $ | 1,169 |
|
Attributable all-in cost(h) from continuing operations per ounce sold on a by-product basis(b) | $ | 1,555 |
| $ | 1,766 |
| $ | 1,543 | $ | 1,552 |
|
Attributable all-in cost(h) from continuing operations per equivalent ounce(c) sold(b) | $ | 1,560 |
| $ | 1,766 |
| $ | 1,547 | $ | 1,555 |
|
(a) Total gold equivalent ounces produced and sold and attributable gold equivalent ounces produced and sold include results from the Kupol, Dvoinoye and Chirano mines up to their disposal. "Total gold equivalent ounces" includes 100% of Chirano production. "Attributable gold equivalent ounces" includes Kinross' share of Chirano (90%) production.
(b) The definition and reconciliation of these non-GAAP financial measures and ratios is included in on pages 18 to 23 of this news release. Non-GAAP financial measures and ratios have no standardized meaning under IFRS and therefore, may not be comparable to similar measures presented by other issuers.
(c) “Gold equivalent ounces” include silver ounces produced and sold converted to a gold equivalent based on a ratio of the average spot market prices for the commodities for each period. The ratio for the third quarter of 2022 was 89.91:1 (third quarter of 2021 – 73.45:1). The ratio for the first nine months of 2022 was 83.22:1 (first nine months of 2021 – 69.90:1).
(d) “Capital expenditures from continuing operations” is as reported as “Additions to property, plant and equipment” on the interim condensed consolidated statements of cash flows.
(e) “Average realized gold price per ounce from continuing operations” is defined as gold metal sales from continuing operations divided by total gold ounces sold from continuing operations.
(f) “Production cost of sales from continuing operations per equivalent ounce sold” is defined as production cost of sales divided by total gold equivalent ounces sold from continuing operations.
(g) On June 15, 2022, the Company announced that it had completed the sale of its Russian operations, which includes the Kupol and Dvoinoye mines and the Udinsk project. On August 10, 2022, the Company announced that it had completed the sale of its Chirano mine in Ghana. Results for the three and nine months ended September 30, 2022 and 2021 are from continuing operations and exclude results from the Company’s Chirano and Russian operations due to the classification of these operations as discontinued as at September 30, 2022.
(h) “Attributable all-in cost” includes Kinross’ share of Manh Choh (70%) costs.
The following operating and financial results are based on third-quarter gold equivalent production and exclude Russian and Ghanaian operations except where noted:
Production: Kinross produced 529,155 Au eq. oz. in Q3 2022 from continuing operations, a 61% increase compared with 328,409 Au eq. oz. in Q3 2021. The year-over-year increase was primarily attributable to higher production at Tasiast due to the temporary suspension of milling operations as a result of the mill fire in June 2021, at Paracatu due to an increase in grade and recovery, and at La Coipa due to the restart and mill ramp-up.
Average realized gold price: The average realized gold price from continuing operations in Q3 2022 was $1,732 per ounce, compared with $1,792 per ounce in Q3 2021.
Revenue: During the third quarter, revenue from continuing operations increased to $856.5 million, compared with $582.4 million during Q3 2021.
Production cost of sales: Production cost of sales from continuing operations per Au eq. oz. sold increased to $941 for the quarter, compared with $891 in Q3 2021, mainly as a result of inflationary cost pressures on key consumables, such as fuel, emulsion and reagents across the portfolio.
Production cost of sales from continuing operations per Au oz. sold2 on a by-product basis was $919 in Q3 2022, compared with $881 in Q3 2021, based on gold sales of 480,775 ounces and silver sales of 1,226,108 ounces.
Margins3: Kinross’ margin from continuing operations per Au eq. oz. sold was $791 for Q3 2022, compared with the Q3 2021 margin of $901.
All-in sustaining cost2: All-in sustaining cost from continuing operations per Au eq. oz. sold was $1,282 in Q3 2022, compared with $1,369 in Q3 2021.
In Q3 2022, all-in sustaining cost from continuing operations per Au oz. sold on a by-product basis was $1,269, compared with $1,365 in Q3 2021.
Operating cash flow: Operating cash flow from continuing operations4 was $173.2 million for Q3 2022, compared with $140.3 million for Q3 2021.
Adjusted operating cash flow from continuing operations2 increased to $259.4 million in Q3 2022, compared with $141.3 million for Q3 2021.
Free cash flow2: Free cash flow from continuing operations in Q3 2022 was an outflow of $24.1 million, however included total working capital changes representing an outflow of $86.2 million10. In Q3 2021, free cash flow was an outflow of $63.5 million.
Earnings: Reported net earnings5 from continuing operations was $65.9 million, or $0.05 per share for Q3 2022, compared with reported net loss of $72.9 million, or $0.06 per share, for Q3 2021. The increase in reported net earnings was mainly due to the temporary suspension of milling operations at Tasiast in June 2021.
Adjusted net earnings from continuing operations2,6 were $68.7 million, or $0.05 per share, for Q3 2022, compared with $11.2 million, or $0.01 per share, for Q3 2021.
Capital expenditures: Capital expenditures from continuing operations decreased to $197.3 million for Q3 2022, compared with $203.8 million for Q3 2021. The decrease was primarily due to mine sequencing at Tasiast, Fort Knox and Round Mountain involving a decrease in capital stripping, partially offset by increased expenditures at La Coipa and an increase in capital stripping at Bald Mountain.
Balance sheet
As of September 30, 2022, Kinross had cash and cash equivalents of $488.4 million, compared with $719.1 million at June 30, 2022.
During the quarter, the Company made net repayments of $100 million on the outstanding balance on its revolving credit facility and maintained its investment grade balance sheet.
As of September 30, 2022, the Company had additional available credit11 of approximately $1.5 billion and total liquidity7 of approximately $2 billion.
________________________
10 Total working capital changes is defined as the sum of the changes in operating assets and liabilities, including income taxes paid, as reported on the interim condensed consolidated statements of cash flows (as shown in the adjusted operating cash flow from continuing operations reconciliation table on page 19 of this news release).
11 “Available credit” is defined as available credit under the Company’s credit facilities and is calculated in Section 6 – Liquidity and Capital Resources of Kinross’ MD&A for the three and nine months ended September 30, 2022.
Return of capital
On September 19, 2022, Kinross announced an enhanced share buyback program, allocating an increased portion of asset sales’ proceeds and excess free cash flow to share buybacks. The Company believes Kinross’ shares offer exceptional returns on invested capital, and that the buyback offers a highly attractive use of excess cash. The buyback program will also allow reinvestment in the business and the maintenance of a strong credit profile.
Reflecting the Company’s financial strength and proceeds from recent asset sales, under the enhanced share buyback program Kinross has re-purchased approximately $180 million in shares, or 60% of the $300 million target for 2022. Year-to-date Kinross has returned approximately $300 million of capital through its enhanced share buyback and quarterly dividend programs, and expects to return total capital of approximately $450 million by year end.
On September 29, 2022, Kinross received approval from the Toronto Stock Exchange to increase its normal course issuer bid (“NCIB”) program. Under the amended NCIB program, the Company is authorized to purchase up to 114,047,070 of its common shares (out of the 1,300,045,558 common shares outstanding as at July 27, 2022) representing 10% of the Company’s public float, during the period starting on August 3, 2022 and ending on August 2, 2023.
As part of its continuing quarterly dividend program, the Company declared a dividend of $0.03 per common share payable on December 15, 2022 to shareholders of record at the close of business on December 1, 2022.
Operating results
Mine-by-mine summaries for 2022 third-quarter operating results may be found on pages 13 and 17 of this news release. Highlights include the following:
At Tasiast, production was largely in line with the previous two quarters, and higher year-over-year due to the temporary suspension of milling operations in June 2021. During the third quarter, planned mill availability, throughput and recovery were lower than expected due to some commissioning challenges. Three new leach tanks were brought online in September and October, which has enabled a new pre-oxidation stage and increased retention time, and is expected to drive higher recoveries. Higher recoveries and mill throughput are expected to result in an increase in fourth quarter production.
Cost of sales per ounce sold was lower quarter-over-quarter due to lower operating waste mined, and lower year-over-year due to the increase in production as a result of the temporary suspension of milling operations in 2021. Cost of sales per ounce sold is expected to decrease in the fourth quarter with the anticipated increase in production.
Paracatu performed well during the quarter, increasing production significantly compared with Q2 2022 and Q3 2021 mainly as a result of higher grade and higher recoveries, with continued high-grade material expected for the remainder of the year driving a further increase in production. Cost of sales per ounce sold was lower quarter-over-quarter mainly due to the increase in production and higher year-over-year mainly due to inflationary pressure on consumables, contractors, labour and maintenance costs.
At Fort Knox, production was largely in line with Q2 2022, and increased compared with Q3 2021 primarily due to higher mill throughput. The site had another strong quarter of stacking onto the leach pad, and solution grades from heap leach processing are increasing, positioning Q4 to be another strong quarter. Cost of sales per ounce sold was in line quarter-over-quarter and increased year-over-year primarily due to inflationary pressure on consumables and higher contractor costs.
At Round Mountain, production was higher than the previous quarter mainly due to more ounces recovered from the heap leach pads, and year-over-year production was largely in line. Cost of sales per ounce sold was lower quarter-over-quarter mainly due to higher production, and higher year-over-year related to inflationary cost pressures on consumables.
The Company has completed the Round Mountain optimization program, which evaluated four primary options to exploit the significant resources at the site: Phase S open pit pushback, Phase W3 open pit pushback, Phase X underground, and Gold Hill underground.
Given the high levels of inflation experienced in Nevada, and the Company’s focus on capital discipline, cash flow generation, and resiliency, Kinross is prioritizing the underground opportunities at Phase X and Gold Hill, and continuing to mine Phase W (W1 and W2). The expansion opportunities at Phase W3 and Phase S have been deferred, and the associated ounces will remain in reserves and could potentially be exploited in the future as the environment improves. The two underground opportunities show potential for higher-margin, higher-return operations at Round Mountain compared to open pit, along with increased flexibility and optionality. A team with underground expertise has been assembled and the Company will be in position to start construction of an underground decline at Phase X next year.
Bald Mountain performed well during the quarter, with production increasing and cost of sales per ounce sold decreasing compared with Q2 2022. The quarter-over-quarter production increase was mainly due to more ounces recovered from the heap leach pads, partially offset by lower grades, while cost of sales per ounce was down mainly as a result of higher capitalized stripping. Year-over-year production was higher primarily due to more ounces recovered from the heap leach pads and, for the same time period, cost of sales per ounce sold was higher largely as a result of inflationary pressure on consumables.
At La Coipa, production increased significantly compared to the second quarter as the mill continued to ramp up and resolve commissioning challenges, and cost of sales per ounce sold were lower quarter-over-quarter mainly due to higher production. The pump and supply chain issues encountered earlier in the year have largely been resolved, with mill throughput steadily increasing month-over-month and October averaging approximately 9,500 tonnes per day (t/d) with multiple days at or above 13,000 t/d. The mill is now expected to steadily increase to a sustained design capacity of 13,000 t/d by the end of Q1 2023.
Development projects
Tasiast
The Tasiast 24k project continues to progress on schedule to reach throughput of 24,000 t/d by mid-2023. Following project completion, it is expected that a ramp-up period will see 24,000 t/d plant throughput transitioning from an intermittent to consistent basis by the end of the year. Procurement is substantially complete, with all major equipment either on site or expected to arrive by year-end. Construction has commenced, and civil and concrete works are well advanced.
The 34MW Tasiast solar power plant continues to advance and is on schedule for completion in the second half of 2023. Engineering design is essentially complete and focused on deliverables for integration, procurement is well advanced with all long-lead critical procurement items ordered and site preparation started in October. The solar project is contributing to the Company’s efforts to reduce its greenhouse gas emissions and is expected to provide approximately 20% of the site’s power.
Great Bear
At the Great Bear project in Red Lake, Ontario, the Company continues to make excellent progress and is on schedule to declare an initial mineral resource in early 2023. The Company also plans to issue a Technical Report to support the resource.
To date, Kinross has drilled approximately 160,000 metres and is on track to complete at least 200,000 metres of exploration and infill drilling in 2022 at the Limb and LP Fault zones. Since its last update on July 27, 2022, the Company has received additional assay results, with a selection of the new results from targets at the LP Fault zone highlighted in the table below.
Drilling results continue to support the view of a high-grade, world-class deposit that underpins the prospect of a large, long-life mining complex. Results have also confirmed gold mineralization with good widths and high grades, including high-grade mineralization at depths of more than 500 metres. These results support the view that the LP Fault zone can support a long-life, high-grade, open-pit and underground mine. The initial results from the recently-completed 35,000 metre grade control drill program have also helped confirm the high grade, continuous nature of the intercepts observed in the LP Fault zone.
The Company is also analyzing an advanced exploration program that would establish an underground decline and allow for more efficient exploration of deeper areas of the LP Fault, along with the nearby Hinge and Limb gold zones, as well as bulk sampling. The Company is targeting a potential start of the advanced program as early as 2024.
Baseline environmental surveys, local community socio-economic studies and engineering activities required for the permitting process are progressing well. Kinross continues to advance its comprehensive local outreach and engagement program for all Red Lake regional communities, including the establishment of a community office. The Company is taking steps to build technical capacity and active site participation in the area of environmental monitoring with Wabauskang and Lac Seul First Nation partners, on whose traditional territories the project is located.
Selected Great Bear Drill Results
See Appendix A for full results.
Hole ID |
| From (m) | To | Width (m) | True | Au | Target |
|
|
|
|
|
|
|
|
BR-545 |
| 428.5 | 453.8 | 25.3 | 24.5 | 3.64 | Yauro |
BR-545 | including | 429.5 | 431.4 | 1.95 | 1.8 | 36.34 |
|
BR-545 | and | 459.5 | 472.8 | 13.35 | 10.3 | 0.38 |
|
BR-545 | and | 486.9 | 492.5 | 5.6 | 5.0 | 0.60 |
|
BR-576 |
| 666.8 | 670.0 | 3.25 | 2.8 | 0.60 | Yuma |
BR-576 | and | 703.0 | 711.1 | 8.1 | 7.1 | 11.83 |
|
BR-576 | including | 704.0 | 707.0 | 3 | 2.8 | 29.54 |
|
BR-576 | and | 742.3 | 755.3 | 13 | 10.3 | 0.43 |
|
BR-576 | and | 809.7 | 815.7 | 6 | 5.0 | 0.59 |
|
BR-596 |
| 687.1 | 694.5 | 7.4 | 6.6 | 3.73 | Yuma |
BR-596 | including | 687.1 | 691.0 | 3.9 | 3.7 | 6.85 |
|
BR-596 | and | 701.0 | 738.8 | 37.75 | 28.3 | 1.03 |
|
BR-612 |
| 399.0 | 412.5 | 13.5 | 12.7 | 1.91 | Auro |
BR-612 | including | 402.0 | 405.0 | 3 | 2.8 | 4.27 |
|
BR-612 | and | 436.0 | 441.0 | 5 | 4.1 | 19.97 |
|
BR-612 | including | 436.0 | 439.5 | 3.5 | 3.1 | 27.77 |
|
BR-612 | and | 461.0 | 466.6 | 5.6 | 4.1 | 1.39 |
|
BR-621 |
| 174.0 | 178.6 | 4.6 | 4.2 | 0.67 | Auro |
BR-621 | and | 189.7 | 205.3 | 15.6 | 14.4 | 0.38 |
|
BR-621 | and | 245.3 | 250.0 | 4.7 | 3.8 | 0.68 |
|
BR-621 | and | 311.5 | 320.0 | 8.5 | 7.7 | 0.51 |
|
BR-621 | and | 330.0 | 374.9 | 44.9 | 43.1 | 2.27 |
|
BR-621 | including | 347.0 | 365.8 | 18.75 | 16.5 | 3.16 |
|
BR-621 | and including | 372.0 | 373.0 | 1 | 1.0 | 26.50 |
|
BR-621 | and | 468.0 | 471.9 | 3.9 | 3.6 | 0.62 |
|
BR-621 | and | 480.5 | 495.0 | 14.5 | 11.2 | 0.48 |
|
BR-623 |
| 545.0 | 551.0 | 6 | 4.4 | 2.03 | Auro |
BR-623 | and | 578.0 | 608.8 | 30.75 | 22.8 | 7.62 |
|
BR-623 | including | 585.7 | 597.0 | 11.3 | 10.9 | 18.60 |
|
BR-623 | and | 627.3 | 628.0 | 0.75 | 0.7 | 18.90 |
|
BR-623 | and | 755.0 | 763.3 | 8.3 | 7.1 | 0.36 |
|
BR-623 | and | 806.7 | 809.6 | 2.95 | 2.8 | 3.23 |
|
BR-624 |
| 634.8 | 652.0 | 17.2 | 13.4 | 0.43 | Auro |
BR-624 | and | 670.0 | 698.5 | 28.5 | 23.1 | 7.11 |
|
BR-624 | including | 677.1 | 684.0 | 6.95 | 5.1 | 26.83 |
|
BR-624 | and | 823.0 | 832.0 | 9.05 | 7.5 | 0.58 |
|
BR-700 |
| 682.8 | 761.3 | 78.5 | 65.9 | 0.67 | Yuma |
BR-700 | and | 802.0 | 817.0 | 15 | 11.9 | 1.88 |
|
BR-700 | including | 812.1 | 813.7 | 1.6 | 1.2 | 15.10 |
|
BR-700 | and | 924.4 | 932.0 | 7.6 | 5.9 | 0.44 |
|
BR-700 | and | 940.7 | 945.5 | 4.75 | 4.1 | 0.45 |
|
Results are preliminary in nature and are subject to on-going QA/QC.
See Appendix B for a LP Fault zone long section.
See Appendix C for a visual representation of the conceptual geological interpretation of the potential Great Bear deposit.
View an interactive 3D model of the Great Bear project here:
https://vrify.com/decks/Great-Bear-Project-Ontario-Canada-September-15-2022 (Updated to September 15, 2022).
Manh Choh
On July 27, 2022, the Company, as the operator of the joint venture, announced that it will proceed with development of the 70%-owned Manh Choh project in Alaska. The project is expected to increase the Company’s production profile in Alaska by a total of approximately 640,000 attributable Au eq. oz. over the life of mine at lower costs. Initial production from Manh Choh is expected in the second half of 2024.
Early works at Manh Choh are focused on camp and initial road access, which are proceeding on schedule and on budget. At Fort Knox foundation work for the processing infrastructure upgrades are underway. Permitting is progressing well and the Company received its wetland permit in the third quarter. Procurement and contracting activities are advancing well, prioritizing local employment and contracting, including with the Native Village of Tetlin.
Lobo-Marte
Kinross continues to advance permitting activities at Lobo-Marte in order to preserve its optionality for Kinross’ long-term portfolio. The Company continues to study opportunities to extend La Coipa’s mine life up to the end of the decade, with the potential additions of a new Puren pushback, as well as the adjacent Coipa Norte and Can-Can pushbacks. Those extensions would enter into the regular permitting cycle in the upcoming years. As a result, the Company has decided to defer submission of the Lobo-Marte Environmental Impact Assessment (EIA), as the content of that application will depend, in part, on the extent of any mine life extensions at La Coipa and other factors such as gold price, local permitting process, and other economic considerations. The Company continues to believe in the project’s long-term development potential as a large, low-cost mine upon the conclusion of mining at La Coipa.
Curlew Basin exploration
At the Curlew exploration project in Washington State, located approximately 35 kilometres north of the Company’s Kettle River mill by paved road, drilling from underground has confirmed the understanding of mineralized vein orientations. The Company is on schedule to declare a mineral resource in early 2023 with the drilling information to date. Underground exploration drilling is still underway and will continue into 2023 after which an updated resource will be presented at a later date as the project is expected to grow beyond the year-end resource.
Exploration drill results received during the quarter include:
Hole # 1116 – 2.4m @ 11.59 g/t Au – West Zone target
Hole # 1118– 2.9m @ 7.12 g/t Au – Stealth target
Hole # 1120– 5.2m @ 5.37 g/t Au – LP target
Round Mountain Gold Hill exploration
At the Gold Hill exploration project, located approximately seven kilometres northeast of Round Mountain in Nevada, exploration drilling continued to return encouraging results. Drilling at the main zone (extension of the Gold Hill pit) has confirmed multiple >150m strike and dip extensions of the primary vein and parallel vein structures. Results received this quarter include:
D-1175 – 2.5m @ 8.04 g/t Au (incl. 0.8m @ 23.3 g/t Au)
D-1173A – 2.3m @ 6.93 g/t Au (incl. 0.3m @ 36.90 g/t Au)
Drilling along the parallel Alexandria vein (600m south of Main) has also returned encouraging results such as D-1176 – 1.9m @ 24.24g/t Au (Incl. 0.4m @ 107g/t Au), as well as visible gold in veins beneath the sinter (assays pending).
Gold Hill is a low sulfidation epithermal vein system consisting of high-grade narrow quartz veins with significant strike continuity. Historic underground mining (current pit area) produced approximately 40koz with a grade of 10g/t Au. Exploration this year focused on testing the strike and dip limits of Main and Alexandria, both of which remain open along strike. Exploration work will continue these efforts, as well as test for parallel veins outside of the two primary zones.
Company guidance
The following section of the news release represents forward-looking information and users are cautioned that actual results may vary. We refer to the risks and assumptions contained in the Cautionary Statement on Forward-Looking Information on page 30 of this news release. This Company Guidance section references all-in sustaining cost per equivalent ounce sold, which is a non-GAAP ratio with no standardized meaning under IFRS and therefore, may not be comparable to similar measures presented by other issuers. The definition of this non-GAAP ratio and comparable reconciliation is included on pages 18 to 23 of this news release.
The Company’s Russian and Ghanaian assets have been excluded from its guidance due to the classification of these assets as discontinued as at September 30, 2022.
As Kinross’ share of Chirano (90%) is excluded from guidance, all 2022 guidance figures are no longer on an attributable basis, but on a total basis.
Production guidance
The Company expects its 2022 production to be approximately 2 million Au eq. oz., mainly due to slower-than-expected ramp-up at La Coipa and challenges associated with commissioning the Tasiast 21k project.
Kinross previously guided 2.3 million and 2.1 million Au eq. oz. (+/- 5%) in 2023 and 2024, respectively. The Company now expects to produce approximately 2.1 million attributable9 Au eq. oz. in 2023 and 2024, respectively, and approximately 2 million attributable9 Au eq. oz. in 2025. This deferral of production is based on thorough assessments that have been completed by our new operations leadership with a focus on more resilient, balanced and de-risked mine plans.
Cost guidance12
The Company expects to be slightly above its revised 2022 production cost of sales guidance of approximately $900 per Au eq. oz. and in line with its revised all-in sustaining cost guidance of approximately $1,240 per Au eq. oz. sold2. In 20218, production cost of sales was $832 per Au eq. oz. and all-in sustaining cost was $1,138 per Au eq. oz. sold2.
________________________
12 Based on a gold price of $1,800 per ounce and an oil price of $100 per barrel (including a $10 per barrel change in the price of oil would be expected to result in an approximate $4 impact on fuel consumption costs on production cost of sales per ounce), as disclosed in Kinross’ Q2 2022 results news release from July 27, 2022. The other key assumptions and sensitivities disclosed in the Company’s original guidance on February 16, 2022 have not changed.
Capital expenditures guidance
Kinross expects its 2022 capital expenditures to be approximately $750 million mainly due to less capitalized stripping across the portfolio and delayed spending on the Tasiast solar power project. Capital expenditures from continuing operations was $822 million for the year ended December 31, 2021. Kinross’ previous 2022 guidance for capital expenditures was $850 million (+/- 5%).
Organizational update
On August 10, 2022, Kinross announced that it had completed the sale of all its interest in the Chirano mine in Ghana to Asante Gold Corporation for total consideration of $225 million in cash and shares. Kinross received $60 million in cash and approximately 35 million Asante common shares upon close, with the remainder in deferred payments.
Since completing the Chirano divestment, as well as completing the divestment of the Company’s assets in Russia on July 15, 2022, Kinross has adjusted its regional head office presence to be more in line with its Americas-focused portfolio. The optimized operating model is expected to keep our go-forward overhead costs at approximately the same per ounce level going forward as we had expected prior to the divestitures.
Further, during the quarter, the Company appointed Claude Schimper to the position of Executive Vice-President and Chief Operating Officer, where he will be responsible for the Company’s operational success. Ned Jalil, Senior Vice-President, Technical Services, has assumed leadership of Kinross’ project development, exploration, geology, metallurgy, mine planning, operations strategy and supply chain functions.
At Tasiast, the Company is engaged in discussions with employee delegates regarding the collective labour agreement, which is set to expire at year-end.
Environment, Social and Governance (ESG) update
Following the publication of Kinross’ 2021 Sustainability and Climate reports in Q1 and Q2 respectively, the Company updated its contributions towards the Sustainable Development Goals developed by the United Nations as important societal goals, including a summary of results at the Chirano mine in Ghana, which was sold during the quarter.
In Mauritania, severe flooding in the Inchiri region in early September affected local cities and communities around the Tasiast mine, including the regional hospital. Kinross provided significant and timely humanitarian relief including food and supplies, as well as the delivery of a container of medical supplies and equipment through our partnership with health NGO, Project C.U.R.E., with a value of approximately $450,000.
Advancing our climate change strategy, Kinross completed an analysis of climate-related scenarios, following the governance recommendations of the Task Force on Climate-related Financial Disclosures. The Company also continued to advance its pipeline of energy efficiency projects, as well as strategic partnerships with various technology providers, Original Equipment Manufacturers and electric utilities. We have continued to improve our governance of climate change risks and opportunities by embedding the forecasting of emissions directly into the life of mine models of each of our assets and projects.
Kinross’ strong ESG performance was externally-recognized in major ESG rankings and ratings. The Company’s S&P Global ESG score increased three points in 2022, ranking in the 96th percentile, the Company’s highest score since 2014, which was driven primarily by improved scores in the Environment dimension. The Company’s Sustainalytics risk rating improved to medium from high and its MSCI score was maintained at “A.”
Conference call details
In connection with this news release, Kinross will hold a conference call and audio webcast on Thursday, November 10, 2022 at 8:00 a.m. EDT to discuss the results, followed by a question-and-answer session. To access the call, please dial:
Canada & US toll-free – +1 (888) 330-2446; Passcode: 4915537
Outside of Canada & US – +1 (240) 789-2732; Passcode: 4915537
Replay (available up to 14 days after the call):
Canada & US toll-free – +1 (800) 770-2030; Passcode: 4915537
Outside of Canada & US – +1 (647) 362-9199; Passcode: 4915537
You may also access the conference call on a listen-only basis via webcast at our website www.kinross.com. The audio webcast will be archived on www.kinross.com.
This release should be read in conjunction with Kinross’ 2022 third-quarter unaudited Financial Statements and Management’s Discussion and Analysis report at www.kinross.com. Kinross’ 2022 third-quarter unaudited Financial Statements and Management’s Discussion and Analysis have been filed with Canadian securities regulators (available at www.sedar.com) and furnished with the U.S. Securities and Exchange Commission (available at www.sec.gov). Kinross shareholders may obtain a copy of the financial statements free of charge upon request to the Company.
About Kinross Gold Corporation
Kinross is a Canadian-based global senior gold mining company with operations and projects in the United States, Brazil, Mauritania, Chile and Canada. Our focus is on delivering value based on the core principles of responsible mining, operational excellence, disciplined growth, and balance sheet strength. Kinross maintains listings on the Toronto Stock Exchange (symbol:K) and the New York Stock Exchange (symbol:KGC).
Media Contact
Samantha Sheffield
Senior Manager, Corporate Communications
phone: 416-365-3034
samantha.sheffield@kinross.com
Investor Relations Contact
Chris Lichtenheldt
Vice-President, Investor Relations
phone: 416-365-2761
chris.lichtenheldt@kinross.com
Review of operations
|
|
|
|
|
|
|
|
|
|
|
| ||||
Three months ended September 30, (unaudited) |
| Gold equivalent ounces |
|
|
|
|
|
|
| ||||||
| Produced |
| Sold |
| Production cost of |
| Production cost of | ||||||||
| 2022 | 2021 |
| 2022 | 2021 |
|
| 2022 |
| 2021 |
|
| 2022 |
| 2021 |
|
|
|
|
|
|
|
|
|
|
|
| ||||
Fort Knox | 75,522 | 71,336 |
| 74,221 | 71,482 |
| $ | 88.6 | $ | 67.7 |
| $ | 1,194 | $ | 947 |
Round Mountain | 62,417 | 63,242 |
| 61,757 | 61,405 |
|
| 87.0 |
| 60.8 |
|
| 1,409 |
| 990 |
Bald Mountain | 65,394 | 55,559 |
| 52,472 | 52,874 |
|
| 51.2 |
| 48.8 |
|
| 976 |
| 923 |
Paracatu | 159,113 | 134,425 |
| 152,616 | 133,924 |
|
| 131.1 |
| 103.7 |
|
| 859 |
| 774 |
La Coipa | 33,955 | - |
| 24,681 | - |
|
| 12.1 |
| - |
|
| 490 |
| - |
Maricunga | - | - |
| 652 | 655 |
|
| 0.5 |
| 0.5 |
|
| 767 |
| 763 |
Americas Total | 396,401 | 324,562 |
| 366,399 | 320,340 |
|
| 370.5 |
| 281.5 |
|
| 1,011 |
| 879 |
|
|
|
|
|
|
|
|
|
|
|
| ||||
Tasiast | 132,754 | 3,847 |
| 128,014 | 4,822 |
|
| 94.8 |
| 8.3 |
|
| 741 |
| 1,721 |
West Africa Total | 132,754 | 3,847 |
| 128,014 | 4,822 |
|
| 94.8 |
| 8.3 |
|
| 741 |
| 1,721 |
|
|
|
|
|
|
|
|
|
|
|
| ||||
Continuing Operations Total | 529,155 | 328,409 |
| 494,413 | 325,162 |
|
| 465.3 |
| 289.8 |
|
| 941 |
| 891 |
|
|
|
|
|
|
|
|
|
|
|
| ||||
Discontinued Operations |
|
|
|
|
|
|
|
|
|
|
| ||||
Kupol | - | 120,822 |
| - | 121,798 |
|
| - |
| 81.8 |
| $ | - | $ | 672 |
Chirano (100%) | 13,522 | 37,588 |
| 15,018 | 34,999 |
|
| 24.3 |
| 49.4 |
|
| 1,618 |
| 1,411 |
| 13,522 | 158,410 |
| 15,018 | 156,797 |
|
| 24.3 |
| 131.2 |
|
|
| ||
|
|
|
|
|
|
|
|
|
|
|
| ||||
|
|
|
|
|
|
|
|
|
|
|
| ||||
| |||||||||||||||
|
|
|
|
|
|
|
|
|
|
|
| ||||
Nine months ended September 30, (unaudited) |
| Gold equivalent ounces |
|
|
|
|
|
|
| ||||||
| Produced |
| Sold |
| Production cost of |
| Production cost of | ||||||||
| 2022 | 2021 |
| 2022 | 2021 |
|
| 2022 |
| 2021 |
|
| 2022 |
| 2021 |
|
|
|
|
|
|
|
|
|
|
|
| ||||
Fort Knox | 207,509 | 190,453 |
| 204,732 | 189,206 |
| $ | 248.6 | $ | 193.1 |
| $ | 1,214 | $ | 1,021 |
Round Mountain | 164,445 | 205,456 |
| 160,171 | 207,218 |
|
| 214.1 |
| 184.1 |
|
| 1,337 |
| 888 |
Bald Mountain | 155,573 | 143,854 |
| 147,961 | 142,507 |
|
| 146.0 |
| 127.4 |
|
| 987 |
| 894 |
Paracatu | 396,545 | 411,891 |
| 387,974 | 404,209 |
|
| 367.3 |
| 295.2 |
|
| 947 |
| 730 |
La Coipa | 41,893 | - |
| 31,780 | - |
|
| 17.8 |
| - |
|
| 560 |
| - |
Maricunga | - | - |
| 2,328 | 1,966 |
|
| 1.5 |
| 1.4 |
|
| 644 |
| 712 |
Americas Total | 965,965 | 951,654 |
| 934,946 | 945,106 |
|
| 995.3 |
| 801.2 |
|
| 1,065 |
| 848 |
|
|
|
|
|
|
|
|
|
|
|
| ||||
Tasiast | 395,589 | 155,249 |
| 372,273 | 159,187 |
|
| 283.9 |
| 112.8 |
|
| 763 |
| 709 |
West Africa Total | 395,589 | 155,249 |
| 372,273 | 159,187 |
|
| 283.9 |
| 112.8 |
|
| 763 |
| 709 |
|
|
|
|
|
|
|
|
|
|
|
| ||||
Continuing Operations Total | 1,361,554 | 1,106,903 |
| 1,307,219 | 1,104,293 |
|
| 1,279.2 |
| 914.0 |
|
| 979 |
| 828 |
|
|
|
|
|
|
|
|
|
|
| |||||
Discontinued Operations |
|
|
|
|
|
|
|
|
|
|
| ||||
Kupol | 169,156 | 364,929 |
| 122,295 | 365,075 |
|
| 83.8 |
| 231.0 |
|
| 685 |
| 633 |
Chirano (100%) | 82,060 | 120,107 |
| 87,823 | 116,660 |
|
| 131.2 |
| 155.9 |
|
| 1,494 |
| 1,336 |
| 251,216 | 485,036 |
| 210,118 | 481,735 |
|
| 215.0 |
| 386.9 |
|
|
| ||
Interim condensed consolidated balance sheets
(unaudited, expressed in millions of U.S. dollars, except share amounts) |
|
|
|
|
|
|
| ||
|
|
|
|
|
|
|
| ||
|
| As at |
| ||||||
|
| September 30, |
|
| December 31, |
|
| ||
|
|
|
|
|
|
|
| ||
Assets |
|
|
|
|
|
|
| ||
Current assets |
|
|
|
|
|
|
| ||
Cash and cash equivalents |
| $ | 488.4 |
|
| $ | 531.5 |
|
|
Restricted cash |
| 8.2 |
|
| 11.4 |
|
| ||
Accounts receivable and other assets |
| 292.2 |
|
| 214.5 |
|
| ||
Current income tax recoverable |
| 6.5 |
|
| 10.2 |
|
| ||
Inventories |
| 1,092.1 |
|
| 1,151.3 |
|
| ||
Unrealized fair value of derivative assets |
| 26.7 |
|
| 30.0 |
|
| ||
|
| 1,914.1 |
|
| 1,948.9 |
|
| ||
Non-current assets |
|
|
|
|
|
|
| ||
Property, plant and equipment |
| 7,860.3 |
|
| 7,617.7 |
|
| ||
Goodwill |
| - |
|
| 158.8 |
|
| ||
Long-term investments |
| 99.0 |
|
| 98.2 |
|
| ||
Other long-term assets |
| 666.1 |
|
| 598.0 |
|
| ||
Deferred tax assets |
| - |
|
| 6.5 |
|
| ||
Total assets |
| $ | 10,539.5 |
|
| $ | 10,428.1 |
|
|
|
|
|
|
|
|
|
| ||
Liabilities |
|
|
|
|
|
|
| ||
Current liabilities |
|
|
|
|
|
|
| ||
Accounts payable and accrued liabilities |
| $ | 495.6 |
|
| $ | 492.70 |
|
|
Current income tax payable |
| 52.6 |
|
| 95.00 |
|
| ||
Current portion of long-term debt and credit facilities |
| 40.0 |
|
| 40.00 |
|
| ||
Current portion of provisions |
| 35.8 |
|
| 90.00 |
|
| ||
Other current liabilities |
| 19.1 |
|
| 23.70 |
|
| ||
|
| 643.1 |
|
| 741.40 |
|
| ||
Non-current liabilities |
|
|
|
|
|
|
| ||
Long-term debt and credit facilities |
| 2,471.6 |
|
| 1,589.90 |
|
| ||
