
 Yahoo Finance
 Kingfisher plc (LON:KGF): Does The Earnings Decline Make It An Underperformer?

Measuring Kingfisher plc’s (LSE:KGF) track record of past performance is an insightful exercise for investors. It enables us to reflect on whether the company has met or exceed expectations, which is a powerful signal for future performance. Below, I will assess KGF’s recent performance announced on 31 January 2018 and compare these figures to its historical trend and industry movements. Check out our latest analysis for Kingfisher
How Well Did KGF Perform?
For the most up-to-date info, I use data from the most recent 12 months, which annualizes the latest 6-month earnings release, or some times, the latest annual report is already the most recent financial data. This technique allows me to assess various companies on a similar basis, using the latest information. For Kingfisher, its most recent trailing-twelve-month earnings is UK£485.00M, which, relative to last year’s level, has fallen by -20.49%. Since these values may be fairly short-term, I’ve created an annualized five-year value for Kingfisher’s earnings, which stands at UK£576.11M This doesn’t seem to paint a better picture, as earnings seem to have consistently been diminishing over the longer term.
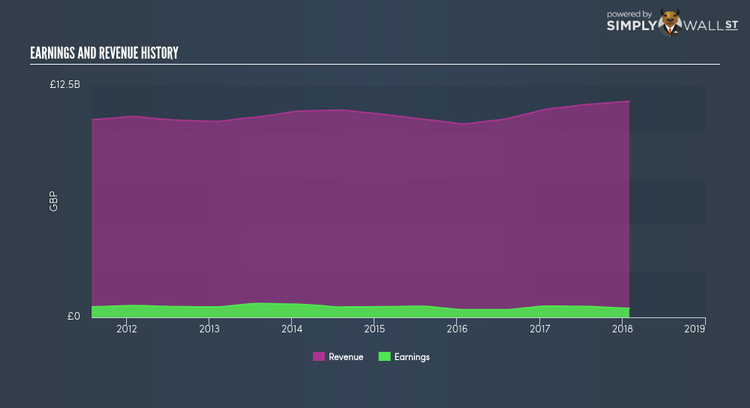
What could be happening here? Well, let’s take a look at what’s transpiring with margins and if the rest of the industry is experiencing the hit as well. Revenue growth over the past few years, has been positive, nevertheless earnings growth has been falling. This implies that Kingfisher has been ramping up expenses, which is hurting margins and earnings, and is not a sustainable practice. Inspecting growth from a sector-level, the UK specialty retail industry has been enduring some headwinds in the prior twelve months, leading to an average earnings drop of -3.11%. This is a momentous change, given that the industry has constantly been delivering a a notable growth of 16.43% in the previous five years. This suggests that whatever recent headwind the industry is facing, it’s hitting Kingfisher harder than its peers.
What does this mean?
Though Kingfisher’s past data is helpful, it is only one aspect of my investment thesis. Usually companies that face a prolonged period of diminishing earnings are undergoing some sort of reinvestment phase However, if the entire industry is struggling to grow over time, it may be a indicator of a structural change, which makes Kingfisher and its peers a riskier investment. You should continue to research Kingfisher to get a more holistic view of the stock by looking at:
Future Outlook: What are well-informed industry analysts predicting for KGF’s future growth? Take a look at our free research report of analyst consensus for KGF’s outlook.
Financial Health: Is KGF’s operations financially sustainable? Balance sheets can be hard to analyze, which is why we’ve done it for you. Check out our financial health checks here.
Other High-Performing Stocks: Are there other stocks that provide better prospects with proven track records? Explore our free list of these great stocks here.
NB: Figures in this article are calculated using data from the trailing twelve months from 31 January 2018. This may not be consistent with full year annual report figures.
To help readers see pass the short term volatility of the financial market, we aim to bring you a long-term focused research analysis purely driven by fundamental data. Note that our analysis does not factor in the latest price sensitive company announcements.
The author is an independent contributor and at the time of publication had no position in the stocks mentioned.
