
 Yahoo Finance
 What Kind Of Shareholders Own Keyera Corp (TSE:KEY)?

A look at the shareholders of Keyera Corp (TSE:KEY) can tell us which group is most powerful. Institutions often own shares in more established companies, while it’s not unusual to see insiders own a fair bit of smaller companies. We also tend to see lower insider ownership in companies that were previously publicly owned.
Keyera has a market capitalization of CA$7.33b, so it’s too big to fly under the radar. We’d expect to see both institutions and retail investors owning a portion of the company. Taking a look at the our data on the ownership groups (below), it’s seems that institutional investors have bought into the company. We can zoom in on the different ownership groups, to learn more about KEY.
See our latest analysis for Keyera
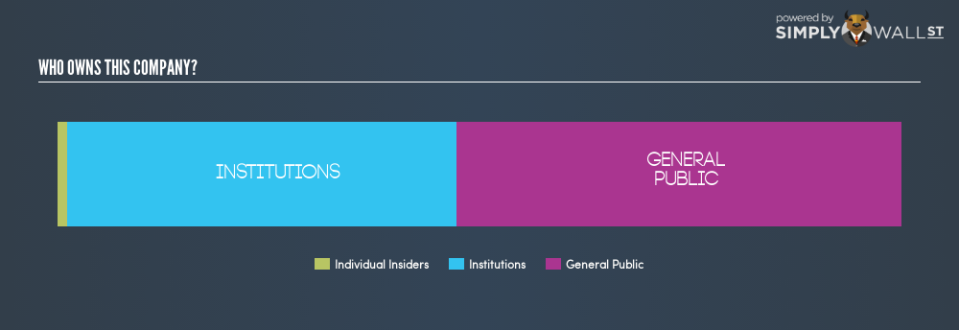
What Does The Institutional Ownership Tell Us About Keyera?
Many institutions measure their performance against an index that approximates the local market. So they usually pay more attention to companies that are included in major indices.
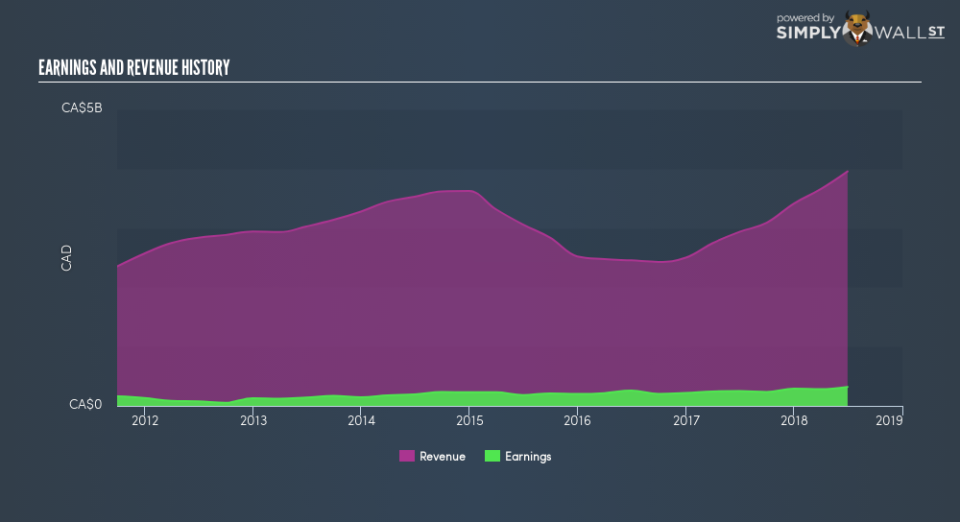
As you can see, institutional investors own 46.1% of Keyera. This suggests some credibility amongst professional investors. But we can’t rely on that fact alone, since institutions make bad investments sometimes, just like everyone does. It is not uncommon to see a big share price drop if two large institutional investors try to sell out of a stock at the same time. So it is worth checking the past earnings trajectory of Keyera, (below). Of course, keep in mind that there are other factors to consider, too.
Keyera is not owned by hedge funds. There are a reasonable number of analysts covering the stock, so it might be useful to find out their aggregate view on the future.
Insider Ownership Of Keyera
While the precise definition of an insider can be subjective, almost everyone considers board members to be insiders. Management ultimately answers to the board. However, it is not uncommon for managers to be executive board members, especially if they are a founder or the CEO.
I generally consider insider ownership to be a good thing. However, on some occasions it makes it more difficult for other shareholders to hold the board accountable for decisions.
Shareholders would probably be interested to learn that insiders own shares in Keyera Corp. The insiders have a meaningful stake worth CA$87.9m. Most would see this as a real positive. If you would like to explore the question of insider alignment, you can click here to see if insiders have been buying or selling.
General Public Ownership
The general public, who are mostly retail investors, collectively hold 52.7% of Keyera shares. This size of ownership gives retail investors collective power. They can and probably do influence decisions on executive compensation, dividend policies and proposed business acquisitions.
Next Steps:
I find it very interesting to look at who exactly owns a company. But to truly gain insight, we need to consider other information, too.
I like to dive deeper into how a company has performed in the past. You can find historic revenue and earnings in this detailed graph.
Ultimately the future is most important. You can access this free report on analyst forecasts for the company.
NB: Figures in this article are calculated using data from the last twelve months, which refer to the 12-month period ending on the last date of the month the financial statement is dated. This may not be consistent with full year annual report figures.
To help readers see past the short term volatility of the financial market, we aim to bring you a long-term focused research analysis purely driven by fundamental data. Note that our analysis does not factor in the latest price-sensitive company announcements.
The author is an independent contributor and at the time of publication had no position in the stocks mentioned. For errors that warrant correction please contact the editor at editorial-team@simplywallst.com.
