
 Yahoo Finance
 What Kind Of Shareholder Appears On The Noble Corporation plc's (NYSE:NE) Shareholder Register?

Want to participate in a short research study? Help shape the future of investing tools and you could win a $250 gift card!
If you want to know who really controls Noble Corporation plc (NYSE:NE), then you'll have to look at the makeup of its share registry. Institutions will often hold stock in bigger companies, and we expect to see insiders owning a noticeable percentage of the smaller ones. Companies that used to be publicly owned tend to have lower insider ownership.
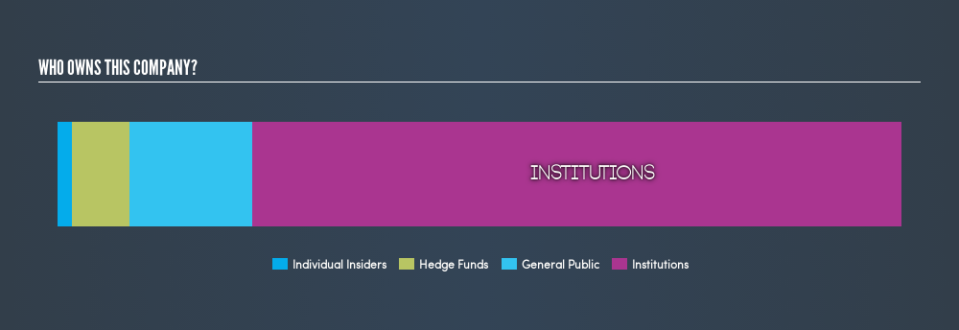
With a market capitalization of US$496m, Noble is a small cap stock, so it might not be well known by many institutional investors. In the chart below below, we can see that institutions own shares in the company. Let's delve deeper into each type of owner, to discover more about NE.
View our latest analysis for Noble
What Does The Institutional Ownership Tell Us About Noble?
Many institutions measure their performance against an index that approximates the local market. So they usually pay more attention to companies that are included in major indices.
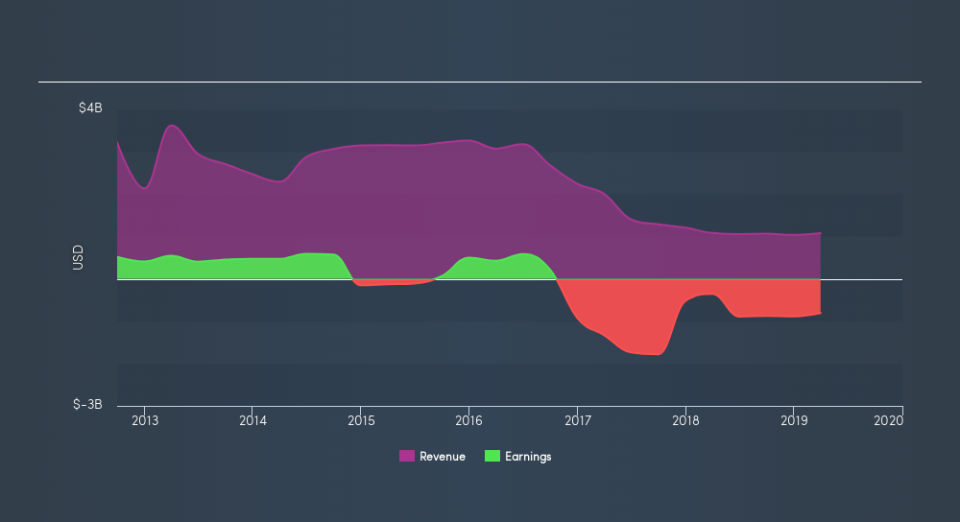
As you can see, institutional investors own 77% of Noble. This suggests some credibility amongst professional investors. But we can't rely on that fact alone, since institutions make bad investments sometimes, just like everyone does. If multiple institutions change their view on a stock at the same time, you could see the share price drop fast. It's therefore worth looking at Noble's earnings history, below. Of course, the future is what really matters.
Institutional investors own over 50% of the company, so together than can probably strongly influence board decisions. Our data indicates that hedge funds own 6.9% of Noble. That catches my attention because hedge funds sometimes try to influence management, or bring about changes that will create near term value for shareholders. Quite a few analysts cover the stock, so you could look into forecast growth quite easily.
Insider Ownership Of Noble
The definition of company insiders can be subjective, and does vary between jurisdictions. Our data reflects individual insiders, capturing board members at the very least. Company management run the business, but the CEO will answer to the board, even if he or she is a member of it.
I generally consider insider ownership to be a good thing. However, on some occasions it makes it more difficult for other shareholders to hold the board accountable for decisions.
We can see that insiders own shares in Noble Corporation plc. In their own names, insiders own US$8.9m worth of stock in the US$496m company. This shows at least some alignment. You can click here to see if those insiders have been buying or selling.
General Public Ownership
The general public, with a 15% stake in the company, will not easily be ignored. This size of ownership, while considerable, may not be enough to change company policy if the decision is not in sync with other large shareholders.
Next Steps:
While it is well worth considering the different groups that own a company, there are other factors that are even more important.
I like to dive deeper into how a company has performed in the past. You can find historic revenue and earnings in this detailed graph.
If you would prefer discover what analysts are predicting in terms of future growth, do not miss this free report on analyst forecasts.
NB: Figures in this article are calculated using data from the last twelve months, which refer to the 12-month period ending on the last date of the month the financial statement is dated. This may not be consistent with full year annual report figures.
We aim to bring you long-term focused research analysis driven by fundamental data. Note that our analysis may not factor in the latest price-sensitive company announcements or qualitative material.
If you spot an error that warrants correction, please contact the editor at editorial-team@simplywallst.com. This article by Simply Wall St is general in nature. It does not constitute a recommendation to buy or sell any stock, and does not take account of your objectives, or your financial situation. Simply Wall St has no position in the stocks mentioned. Thank you for reading.
