
 Yahoo Finance
 What Kind Of Share Price Volatility Should You Expect For Aquila Resources Inc. (TSE:AQA)?

If you own shares in Aquila Resources Inc. (TSE:AQA) then it's worth thinking about how it contributes to the volatility of your portfolio, overall. In finance, Beta is a measure of volatility. Modern finance theory considers volatility to be a measure of risk, and there are two main types of price volatility. First, we have company specific volatility, which is the price gyrations of an individual stock. Holding at least 8 stocks can reduce this kind of risk across a portfolio. The second type is the broader market volatility, which you cannot diversify away, since it arises from macroeconomic factors which directly affects all the stocks on the market.
Some stocks are more sensitive to general market forces than others. Some investors use beta as a measure of how much a certain stock is impacted by market risk (volatility). While we should keep in mind that Warren Buffett has cautioned that 'Volatility is far from synonymous with risk', beta is still a useful factor to consider. To make good use of it you must first know that the beta of the overall market is one. A stock with a beta below one is either less volatile than the market, or more volatile but not corellated with the overall market. In comparison a stock with a beta of over one tends to be move in a similar direction to the market in the long term, but with greater changes in price.
See our latest analysis for Aquila Resources
What AQA's beta value tells investors
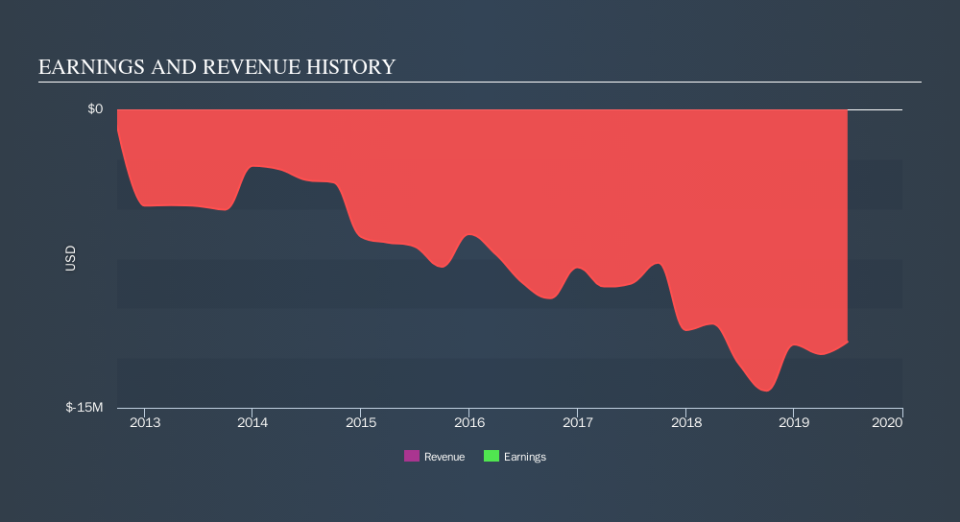
Aquila Resources has a five-year beta of 1.07. This is reasonably close to the market beta of 1, so the stock has in the past displayed similar levels of volatility to the overall market. If the future looks like the past, we could therefore consider it likely that the stock price will experience share price volatility that is roughly similar to the overall market. Share price volatility is well worth considering, but most long term investors consider the history of revenue and earnings growth to be more important. Take a look at how Aquila Resources fares in that regard, below.
How does AQA's size impact its beta?
With a market capitalisation of CA$51m, Aquila Resources is a very small company by global standards. It is quite likely to be unknown to most investors. It doesn't take much money to really move the share price of a company as small as this one. That makes it somewhat unusual that it has a beta value so close to the overall market.
What this means for you:
Since Aquila Resources has a beta close to one, it will probably show a positive return when the market is moving up, based on history. If you're trying to generate better returns than the market, it would be worth thinking about other metrics such as cashflows, dividends and revenue growth might be a more useful guide to the future. This article aims to educate investors about beta values, but it's well worth looking at important company-specific fundamentals such as Aquila Resources’s financial health and performance track record. I highly recommend you dive deeper by considering the following:
Financial Health: Are AQA’s operations financially sustainable? Balance sheets can be hard to analyze, which is why we’ve done it for you. Check out our financial health checks here.
Past Track Record: Has AQA been consistently performing well irrespective of the ups and downs in the market? Go into more detail in the past performance analysis and take a look at the free visual representations of AQA's historicals for more clarity.
Other High-Performing Stocks: Are there other stocks that provide better prospects with proven track records? Explore our free list of these great stocks here.
We aim to bring you long-term focused research analysis driven by fundamental data. Note that our analysis may not factor in the latest price-sensitive company announcements or qualitative material.
If you spot an error that warrants correction, please contact the editor at editorial-team@simplywallst.com. This article by Simply Wall St is general in nature. It does not constitute a recommendation to buy or sell any stock, and does not take account of your objectives, or your financial situation. Simply Wall St has no position in the stocks mentioned. Thank you for reading.
