
 Yahoo Finance
 What Kind Of Investor Owns Most Of TMX Group Limited (TSE:X)?

Want to participate in a research study? Help shape the future of investing tools and earn a $60 gift card!
Every investor in TMX Group Limited (TSE:X) should be aware of the most powerful shareholder groups. Institutions will often hold stock in bigger companies, and we expect to see insiders owning a noticeable percentage of the smaller ones. We also tend to see lower insider ownership in companies that were previously publicly owned.
TMX Group is a pretty big company. It has a market capitalization of CA$4.7b. Normally institutions would own a significant portion of a company this size. Taking a look at our data on the ownership groups (below), it’s seems that institutional investors have bought into the company. Let’s delve deeper into each type of owner, to discover more about X.
See our latest analysis for TMX Group
What Does The Institutional Ownership Tell Us About TMX Group?
Institutional investors commonly compare their own returns to the returns of a commonly followed index. So they generally do consider buying larger companies that are included in the relevant benchmark index.
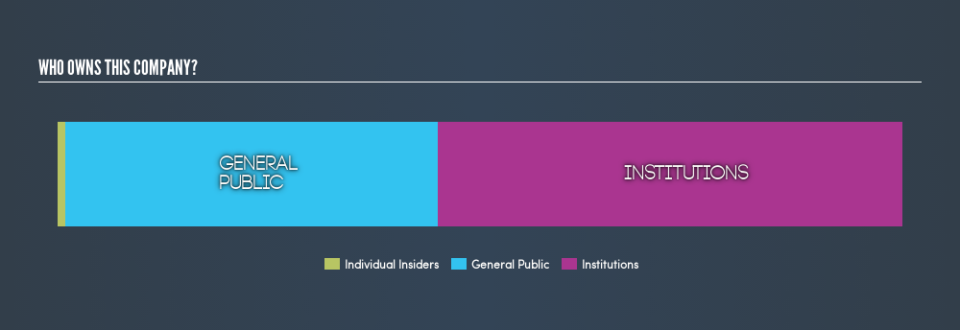
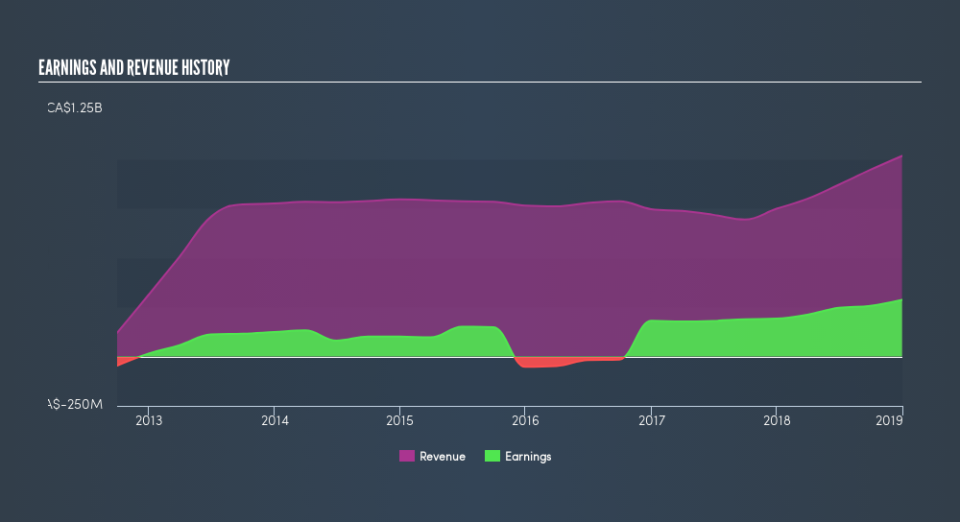
We can see that TMX Group does have institutional investors; and they hold 55% of the stock. This implies the analysts working for those institutions have looked at the stock and they like it. But just like anyone else, they could be wrong. If multiple institutions change their view on a stock at the same time, you could see the share price drop fast. It’s therefore worth looking at TMX Group’s earnings history, below. Of course, the future is what really matters.
Since institutional investors own more than half the issued stock, the board will likely have to pay attention to their preferences. TMX Group is not owned by hedge funds. Quite a few analysts cover the stock, so you could look into forecast growth quite easily.
Insider Ownership Of TMX Group
While the precise definition of an insider can be subjective, almost everyone considers board members to be insiders. Management ultimately answers to the board. However, it is not uncommon for managers to be executive board members, especially if they are a founder or the CEO.
I generally consider insider ownership to be a good thing. However, on some occasions it makes it more difficult for other shareholders to hold the board accountable for decisions.
I can report that insiders do own shares in TMX Group Limited. This is a big company, so it is good to see this level of alignment. Insiders own CA$51m worth of shares (at current prices). It is good to see this level of investment by insiders. You can check here to see if those insiders have been buying recently.
General Public Ownership
With a 44% ownership, the general public have some degree of sway over X. While this group can’t necessarily call the shots, it can certainly have a real influence on how the company is run.
Next Steps:
While it is well worth considering the different groups that own a company, there are other factors that are even more important.
I like to dive deeper into how a company has performed in the past. You can access this interactive graph of past earnings, revenue and cash flow, for free .
If you are like me, you may want to think about whether this company will grow or shrink. Luckily, you can check this free report showing analyst forecasts for its future.
NB: Figures in this article are calculated using data from the last twelve months, which refer to the 12-month period ending on the last date of the month the financial statement is dated. This may not be consistent with full year annual report figures.
We aim to bring you long-term focused research analysis driven by fundamental data. Note that our analysis may not factor in the latest price-sensitive company announcements or qualitative material.
If you spot an error that warrants correction, please contact the editor at editorial-team@simplywallst.com. This article by Simply Wall St is general in nature. It does not constitute a recommendation to buy or sell any stock, and does not take account of your objectives, or your financial situation. Simply Wall St has no position in the stocks mentioned. Thank you for reading.
