
 Yahoo Finance
 What Kind Of Investor Owns Most Of Sylogist Ltd. (CVE:SYZ)?

Every investor in Sylogist Ltd. (CVE:SYZ) should be aware of the most powerful shareholder groups. Large companies usually have institutions as shareholders, and we usually see insiders owning shares in smaller companies. I quite like to see at least a little bit of insider ownership. As Charlie Munger said 'Show me the incentive and I will show you the outcome.
With a market capitalization of CA$249m, Sylogist is a small cap stock, so it might not be well known by many institutional investors. In the chart below below, we can see that institutional investors have bought into the company. Let's delve deeper into each type of owner, to discover more about SYZ.
See our latest analysis for Sylogist
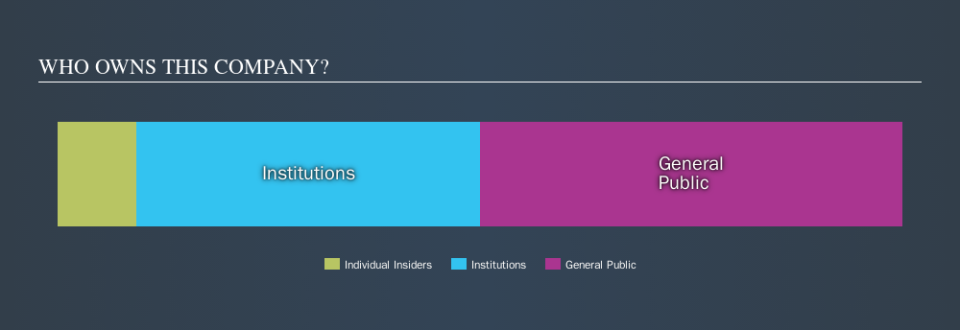
What Does The Institutional Ownership Tell Us About Sylogist?
Institutional investors commonly compare their own returns to the returns of a commonly followed index. So they generally do consider buying larger companies that are included in the relevant benchmark index.
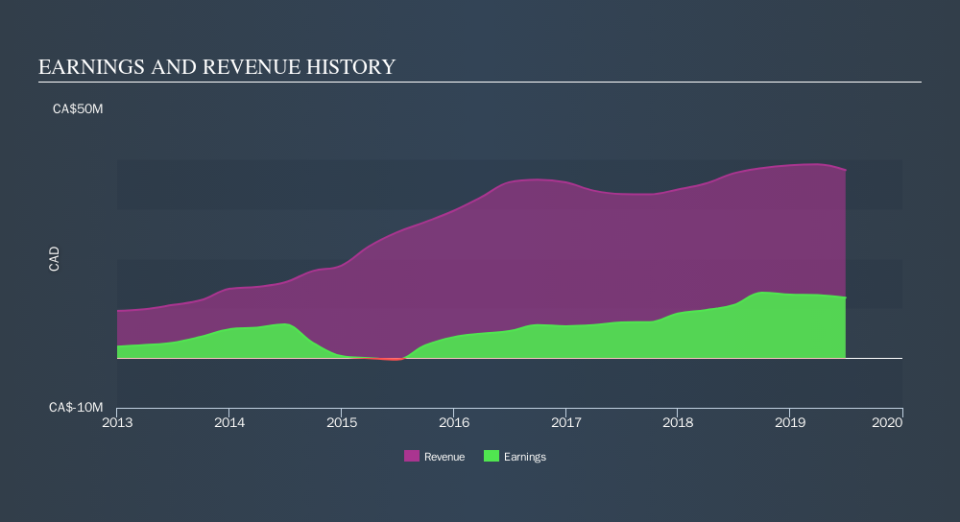
We can see that Sylogist does have institutional investors; and they hold 41% of the stock. This can indicate that the company has a certain degree of credibility in the investment community. However, it is best to be wary of relying on the supposed validation that comes with institutional investors. They too, get it wrong sometimes. It is not uncommon to see a big share price drop if two large institutional investors try to sell out of a stock at the same time. So it is worth checking the past earnings trajectory of Sylogist, (below). Of course, keep in mind that there are other factors to consider, too.
Sylogist is not owned by hedge funds. There is some analyst coverage of the stock, but it could still become more well known, with time.
Insider Ownership Of Sylogist
The definition of an insider can differ slightly between different countries, but members of the board of directors always count. Company management run the business, but the CEO will answer to the board, even if he or she is a member of it.
I generally consider insider ownership to be a good thing. However, on some occasions it makes it more difficult for other shareholders to hold the board accountable for decisions.
I can report that insiders do own shares in Sylogist Ltd.. As individuals, the insiders collectively own CA$23m worth of the CA$249m company. Some would say this shows alignment of interests between shareholders and the board, though I generally prefer to see bigger insider holdings. But it might be worth checking if those insiders have been selling.
General Public Ownership
With a 50% ownership, the general public have some degree of sway over SYZ. While this size of ownership may not be enough to sway a policy decision in their favour, they can still make a collective impact on company policies.
Next Steps:
It's always worth thinking about the different groups who own shares in a company. But to understand Sylogist better, we need to consider many other factors.
I like to dive deeper into how a company has performed in the past. You can find historic revenue and earnings in this detailed graph.
Ultimately the future is most important. You can access this free report on analyst forecasts for the company.
NB: Figures in this article are calculated using data from the last twelve months, which refer to the 12-month period ending on the last date of the month the financial statement is dated. This may not be consistent with full year annual report figures.
We aim to bring you long-term focused research analysis driven by fundamental data. Note that our analysis may not factor in the latest price-sensitive company announcements or qualitative material.
If you spot an error that warrants correction, please contact the editor at editorial-team@simplywallst.com. This article by Simply Wall St is general in nature. It does not constitute a recommendation to buy or sell any stock, and does not take account of your objectives, or your financial situation. Simply Wall St has no position in the stocks mentioned. Thank you for reading.
