Advertisement
Canada markets closed
  • S&P/TSX

    21,728.55
    +14.01 (+0.06%)
     
  • S&P 500

    5,018.39
    -17.30 (-0.34%)
     
  • DOW

    37,903.29
    +87.37 (+0.23%)
     
  • CAD/USD

    0.7283
    +0.0022 (+0.31%)
     
  • CRUDE OIL

    79.10
    +0.10 (+0.13%)
     
  • Bitcoin CAD

    79,420.73
    -3,488.83 (-4.21%)
     
  • CMC Crypto 200

    1,273.22
    -65.85 (-4.92%)
     
  • GOLD FUTURES

    2,329.70
    +18.70 (+0.81%)
     
  • RUSSELL 2000

    1,980.23
    +6.32 (+0.32%)
     
  • 10-Yr Bond

    4.5950
    -0.0910 (-1.94%)
     
  • NASDAQ futures

    17,494.50
    +56.25 (+0.32%)
     
  • VOLATILITY

    15.39
    -0.26 (-1.66%)
     
  • FTSE

    8,121.24
    -22.89 (-0.28%)
     
  • NIKKEI 225

    38,274.05
    -131.61 (-0.34%)
     
  • CAD/EUR

    0.6794
    -0.0008 (-0.12%)
     

Kentucky closer to U.S. in economic measures than decades ago, but gaps remain

When Congress established the Appalachian Regional Commission (ARC) in 1965, the idea was to improve the economy in the region and help it achieve economic parity with the rest of the nation.

The 1965 act declared that the region had abundant natural resources and rich potential, but “lags behind the rest of the Nation in its economic growth and that its people have not shared properly in the Nation’s prosperity.”

Since then, the ARC has spent $4.5 billion on economic-development projects in the 13-state region, much of it for infrastructure.

The spending on projects for Kentucky — either solely in the state or for multi-state projects that benefited Kentucky — totaled more than $486 million in just the last 20 years, according to Kathryn Whiteman, a program analyst with ARC.

ADVERTISEMENT

The gaps in economic and education measures between Eastern Kentucky and the rest of the U.S. have narrowed since the mid-1960s, but the region hasn’t drawn completely even.

There is a relative lack of good-paying jobs, as well as losses in coal and other sectors, though poverty was relatively high even before most coal jobs disappeared. Poor funding for schools through much of the 20th Century helps explain the lag in some education measures.

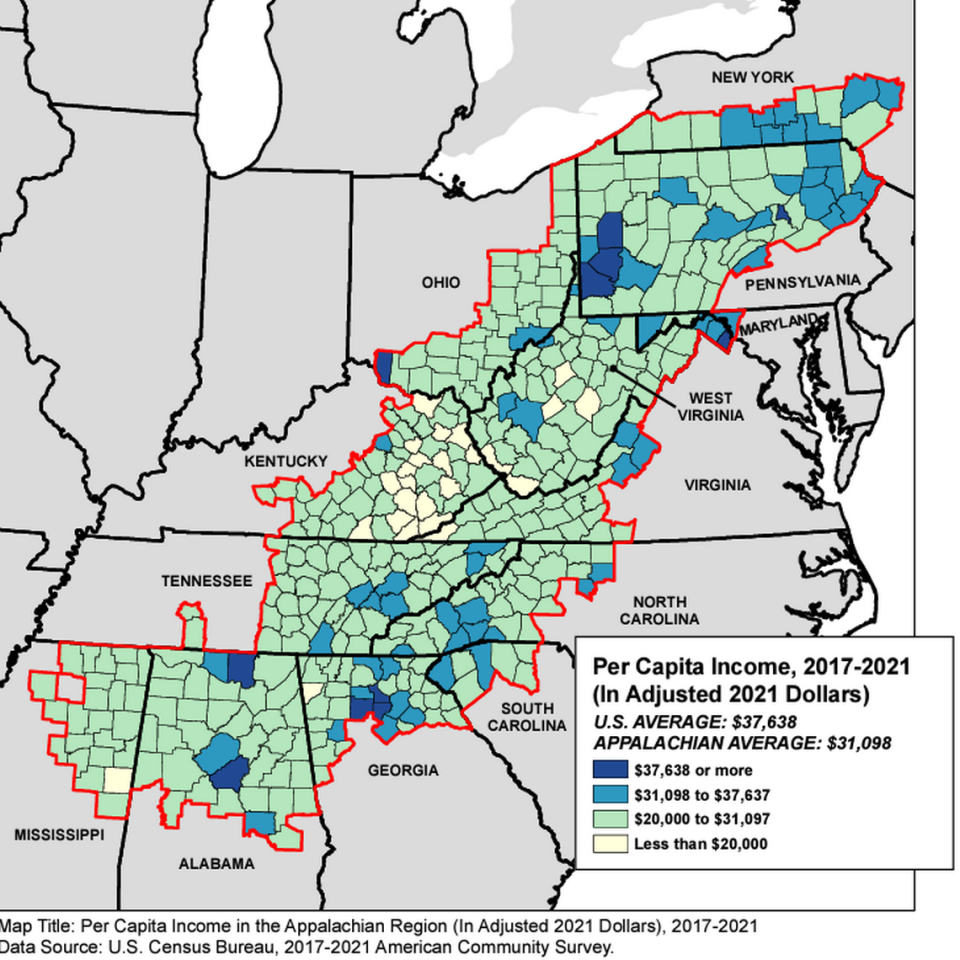
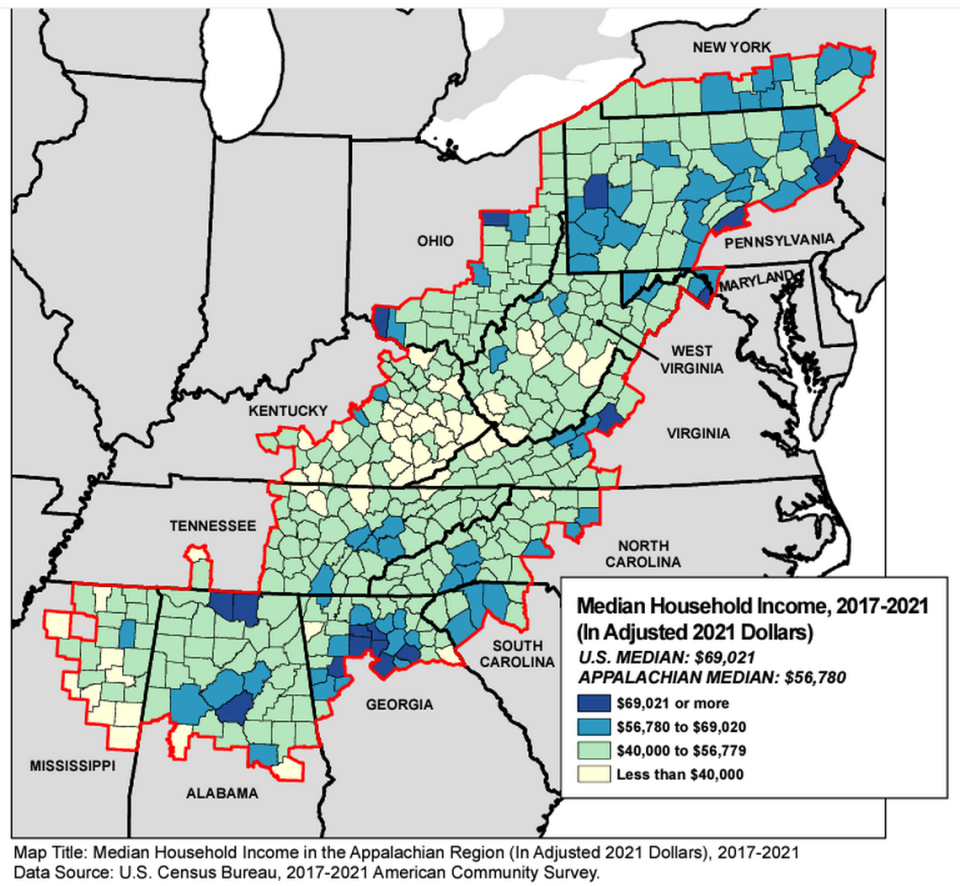
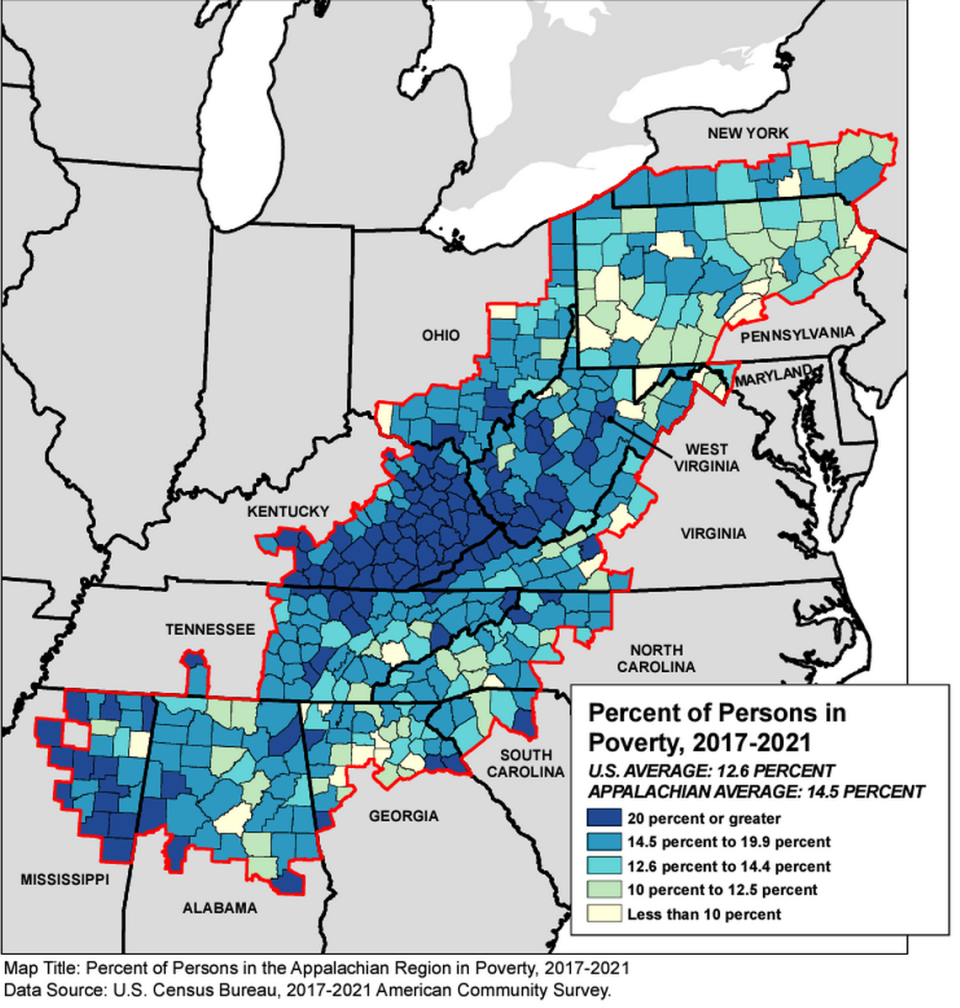
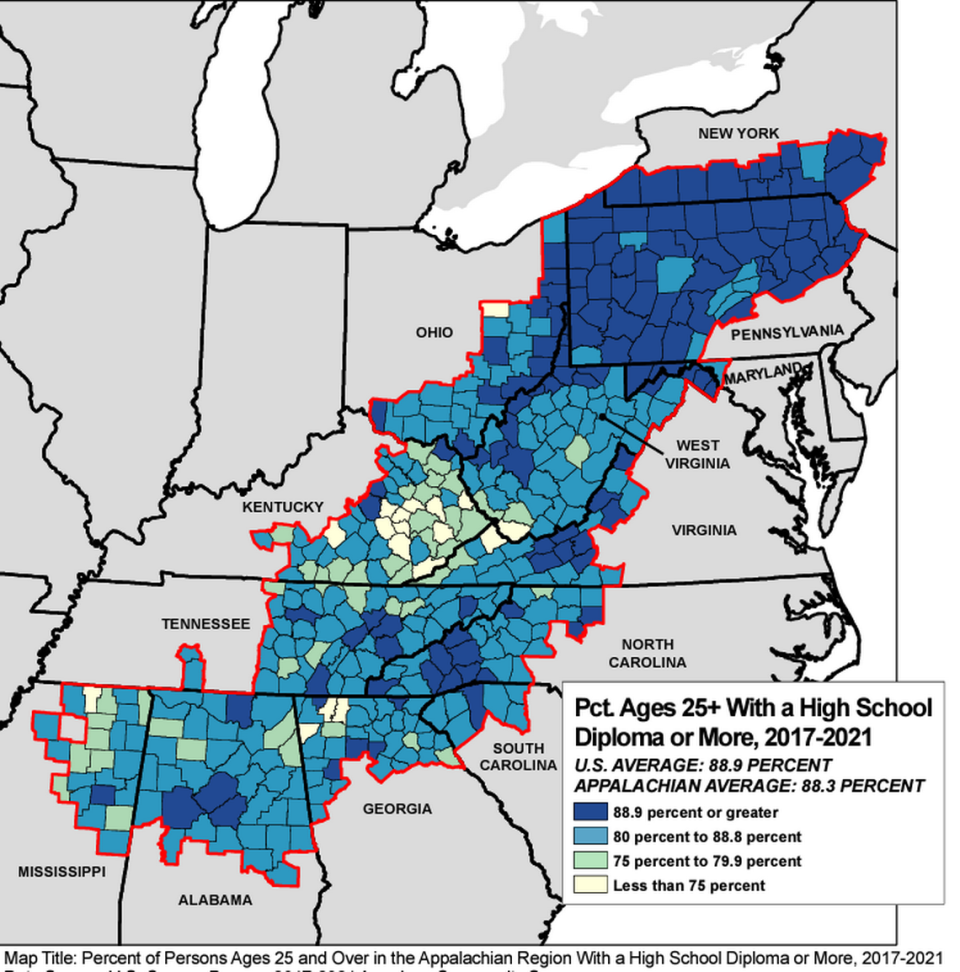
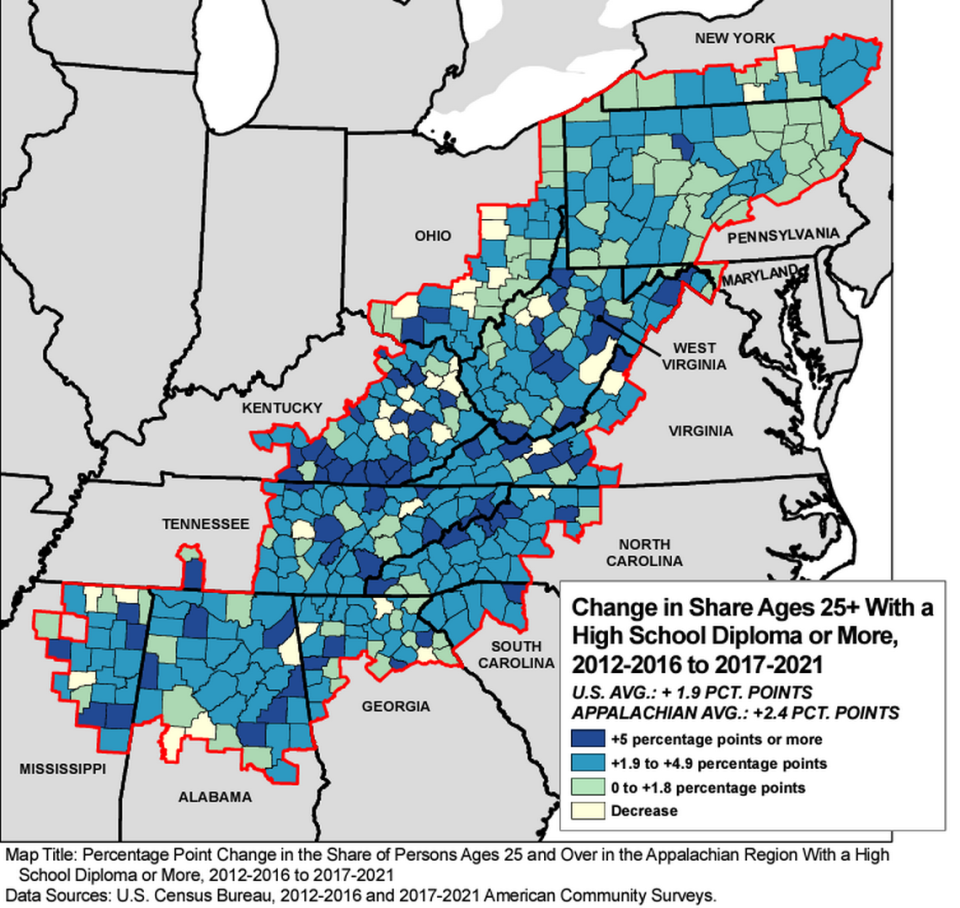
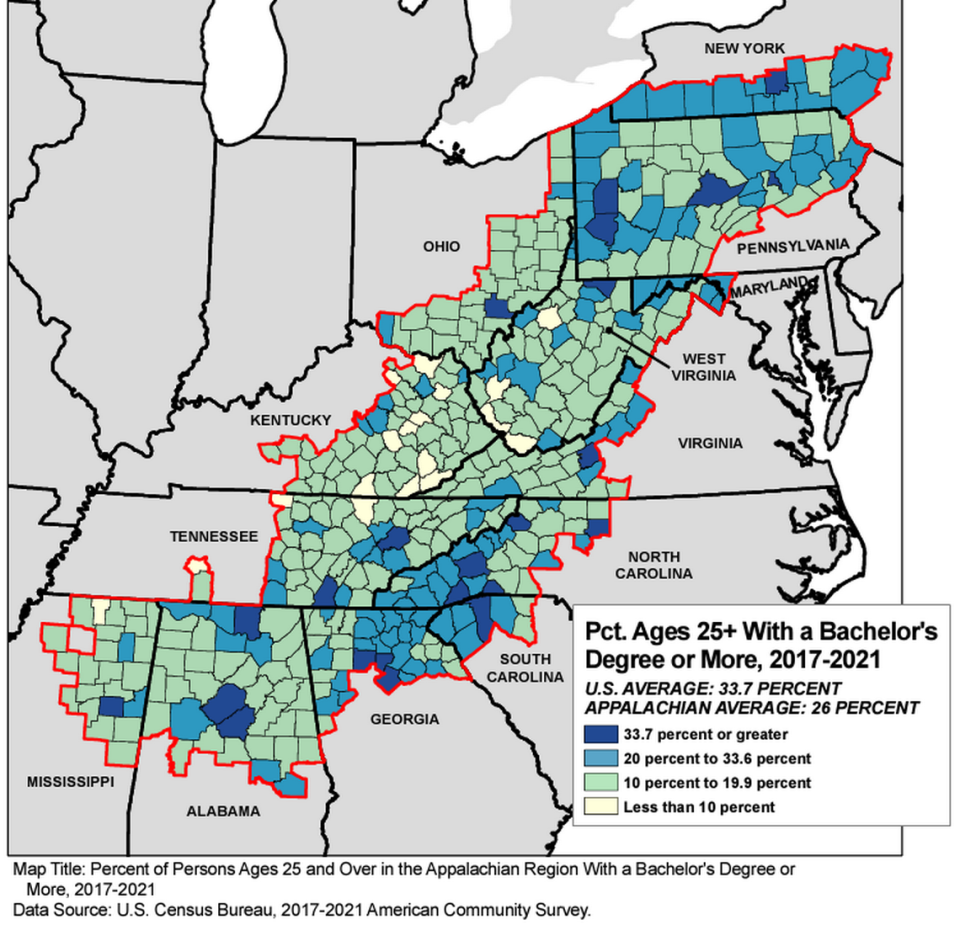
Here are some maps from the most recent edition of the ARC Chartbook, a compilation of data covering 2017 to 2021, on some of those measures.

Per capita income, a measure of the amount of money earned per person, in Eastern Kentucky was below the national level between 2017 and 2021.
Median household is mid-point of incomes in a country or area, with half below and half above. The level was lower in Eastern Kentucky in 2017 to 2021 than in the country.
The percentage of people considered economically poor was higher in many Eastern Kentucky counties than in the nation between 2017 and 2021.
The percentage of people ages 25 and up with a high school education was lower in many Eastern Kentucky counties than in the U.S.
The percentage of people age 25 and up with a high school degree grew faster in Appalachian Kentucky from 2017 through 2021 than in the U.S. as a whole.
The percentage of people in Appalachian Kentucky age 25 and up with at least a bachelor’s degree was lower than the U.S. level. The data are from 2017 through 2021.