
 Yahoo Finance
 As Kaspi.kz (LON:KSPI) hikes 23% this past week, investors may now be noticing the company's one-year earnings growth
Joint Stock Company Kaspi.kz (LON:KSPI) shareholders should be happy to see the share price up 23% in the last week. But that doesn't change the fact that the returns over the last year have been disappointing. During that time the share price has sank like a stone, descending 54%. Some might say the recent bounce is to be expected after such a bad drop. Of course, it could be that the fall was overdone.
The recent uptick of 23% could be a positive sign of things to come, so let's take a lot at historical fundamentals.
See our latest analysis for Kaspi.kz
There is no denying that markets are sometimes efficient, but prices do not always reflect underlying business performance. One way to examine how market sentiment has changed over time is to look at the interaction between a company's share price and its earnings per share (EPS).
Even though the Kaspi.kz share price is down over the year, its EPS actually improved. It could be that the share price was previously over-hyped.
The divergence between the EPS and the share price is quite notable, during the year. So it's well worth checking out some other metrics, too.
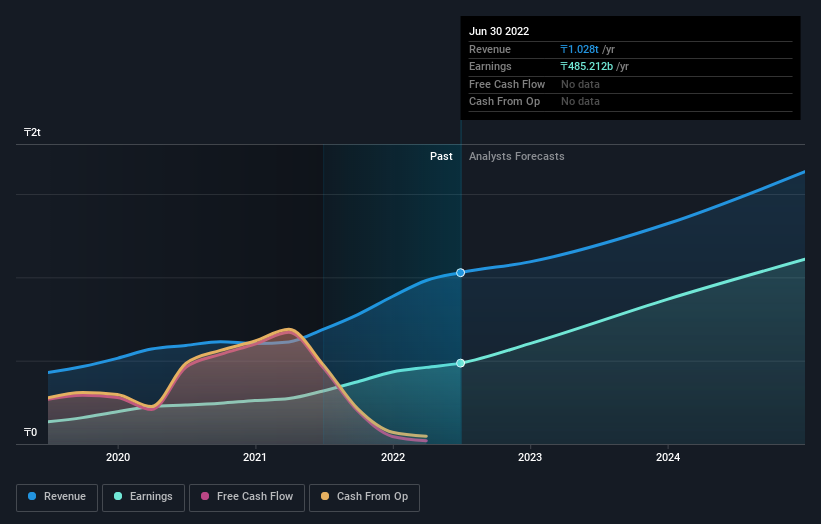
Kaspi.kz's dividend seems healthy to us, so we doubt that the yield is a concern for the market. From what we can see, revenue is pretty flat, so that doesn't really explain the share price drop. Of course, it could simply be that it simply fell short of the market consensus expectations.
You can see below how earnings and revenue have changed over time (discover the exact values by clicking on the image).
It is of course excellent to see how Kaspi.kz has grown profits over the years, but the future is more important for shareholders. If you are thinking of buying or selling Kaspi.kz stock, you should check out this FREE detailed report on its balance sheet.
A Different Perspective
Kaspi.kz shareholders are down 53% for the year (even including dividends), even worse than the market loss of 2.0%. There's no doubt that's a disappointment, but the stock may well have fared better in a stronger market. The share price decline has continued throughout the most recent three months, down 19%, suggesting an absence of enthusiasm from investors. Given the relatively short history of this stock, we'd remain pretty wary until we see some strong business performance. While it is well worth considering the different impacts that market conditions can have on the share price, there are other factors that are even more important. For instance, we've identified 2 warning signs for Kaspi.kz that you should be aware of.
But note: Kaspi.kz may not be the best stock to buy. So take a peek at this free list of interesting companies with past earnings growth (and further growth forecast).
Please note, the market returns quoted in this article reflect the market weighted average returns of stocks that currently trade on GB exchanges.
Have feedback on this article? Concerned about the content? Get in touch with us directly. Alternatively, email editorial-team (at) simplywallst.com.
This article by Simply Wall St is general in nature. We provide commentary based on historical data and analyst forecasts only using an unbiased methodology and our articles are not intended to be financial advice. It does not constitute a recommendation to buy or sell any stock, and does not take account of your objectives, or your financial situation. We aim to bring you long-term focused analysis driven by fundamental data. Note that our analysis may not factor in the latest price-sensitive company announcements or qualitative material. Simply Wall St has no position in any stocks mentioned.
Join A Paid User Research Session
You’ll receive a US$30 Amazon Gift card for 1 hour of your time while helping us build better investing tools for the individual investors like yourself. Sign up here
