
 Yahoo Finance
 Kaizen Discovery Inc. (CVE:KZD): What Does Its Beta Value Mean For Your Portfolio?

If you own shares in Kaizen Discovery Inc. (CVE:KZD) then it's worth thinking about how it contributes to the volatility of your portfolio, overall. In finance, Beta is a measure of volatility. Volatility is considered to be a measure of risk in modern finance theory. Investors may think of volatility as falling into two main categories. First, we have company specific volatility, which is the price gyrations of an individual stock. Holding at least 8 stocks can reduce this kind of risk across a portfolio. The second sort is caused by the natural volatility of markets, overall. For example, certain macroeconomic events will impact (virtually) all stocks on the market.
Some stocks mimic the volatility of the market quite closely, while others demonstrate muted, exagerrated or uncorrelated price movements. Beta can be a useful tool to understand how much a stock is influenced by market risk (volatility). However, Warren Buffett said 'volatility is far from synonymous with risk' in his 2014 letter to investors. So, while useful, beta is not the only metric to consider. To use beta as an investor, you must first understand that the overall market has a beta of one. A stock with a beta below one is either less volatile than the market, or more volatile but not corellated with the overall market. In comparison a stock with a beta of over one tends to be move in a similar direction to the market in the long term, but with greater changes in price.
View our latest analysis for Kaizen Discovery
What does KZD's beta value mean to investors?
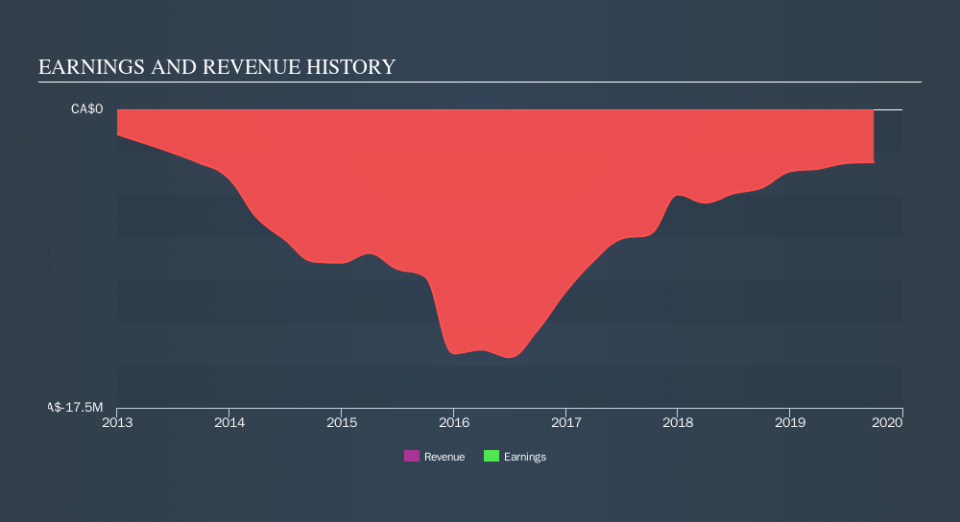
Given that it has a beta of 1.92, we can surmise that the Kaizen Discovery share price has been fairly sensitive to market volatility (over the last 5 years). If the past is any guide, we would expect that Kaizen Discovery shares will rise quicker than the markets in times of optimism, but fall faster in times of pessimism. Share price volatility is well worth considering, but most long term investors consider the history of revenue and earnings growth to be more important. Take a look at how Kaizen Discovery fares in that regard, below.
Could KZD's size cause it to be more volatile?
With a market capitalisation of CA$11m, Kaizen Discovery is a very small company by global standards. It is quite likely to be unknown to most investors. It has a relatively high beta, suggesting it is fairly actively traded for a company of its size. Because it takes less capital to move the share price of a small company like this, when a stock this size is actively traded it is quite often more sensitive to market volatility than similar large companies.
What this means for you:
Since Kaizen Discovery tends to moves up when the market is going up, and down when it's going down, potential investors may wish to reflect on the overall market, when considering the stock. In order to fully understand whether KZD is a good investment for you, we also need to consider important company-specific fundamentals such as Kaizen Discovery’s financial health and performance track record. I urge you to continue your research by taking a look at the following:
Past Track Record: Has KZD been consistently performing well irrespective of the ups and downs in the market? Go into more detail in the past performance analysis and take a look at the free visual representations of KZD's historicals for more clarity.
Other High-Performing Stocks: Are there other stocks that provide better prospects with proven track records? Explore our free list of these great stocks here.
We aim to bring you long-term focused research analysis driven by fundamental data. Note that our analysis may not factor in the latest price-sensitive company announcements or qualitative material.
If you spot an error that warrants correction, please contact the editor at editorial-team@simplywallst.com. This article by Simply Wall St is general in nature. It does not constitute a recommendation to buy or sell any stock, and does not take account of your objectives, or your financial situation. Simply Wall St has no position in the stocks mentioned. Thank you for reading.
