
 Yahoo Finance
 Joint (NASDAQ:JYNT) Will Be Hoping To Turn Its Returns On Capital Around
Finding a business that has the potential to grow substantially is not easy, but it is possible if we look at a few key financial metrics. One common approach is to try and find a company with returns on capital employed (ROCE) that are increasing, in conjunction with a growing amount of capital employed. Put simply, these types of businesses are compounding machines, meaning they are continually reinvesting their earnings at ever-higher rates of return. In light of that, when we looked at Joint (NASDAQ:JYNT) and its ROCE trend, we weren't exactly thrilled.
Return On Capital Employed (ROCE): What Is It?
If you haven't worked with ROCE before, it measures the 'return' (pre-tax profit) a company generates from capital employed in its business. The formula for this calculation on Joint is:
Return on Capital Employed = Earnings Before Interest and Tax (EBIT) ÷ (Total Assets - Current Liabilities)
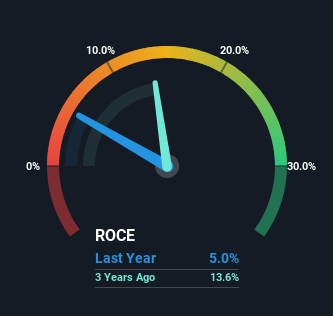
0.05 = US$2.6m ÷ (US$86m - US$33m) (Based on the trailing twelve months to March 2024).
Thus, Joint has an ROCE of 5.0%. In absolute terms, that's a low return and it also under-performs the Healthcare industry average of 11%.
Check out our latest analysis for Joint
In the above chart we have measured Joint's prior ROCE against its prior performance, but the future is arguably more important. If you're interested, you can view the analysts predictions in our free analyst report for Joint .
The Trend Of ROCE
When we looked at the ROCE trend at Joint, we didn't gain much confidence. Over the last five years, returns on capital have decreased to 5.0% from 8.1% five years ago. Although, given both revenue and the amount of assets employed in the business have increased, it could suggest the company is investing in growth, and the extra capital has led to a short-term reduction in ROCE. If these investments prove successful, this can bode very well for long term stock performance.
Our Take On Joint's ROCE
In summary, despite lower returns in the short term, we're encouraged to see that Joint is reinvesting for growth and has higher sales as a result. However, despite the promising trends, the stock has fallen 28% over the last five years, so there might be an opportunity here for astute investors. So we think it'd be worthwhile to look further into this stock given the trends look encouraging.
On a final note, we've found 1 warning sign for Joint that we think you should be aware of.
While Joint may not currently earn the highest returns, we've compiled a list of companies that currently earn more than 25% return on equity. Check out this free list here.
Have feedback on this article? Concerned about the content? Get in touch with us directly. Alternatively, email editorial-team (at) simplywallst.com.
This article by Simply Wall St is general in nature. We provide commentary based on historical data and analyst forecasts only using an unbiased methodology and our articles are not intended to be financial advice. It does not constitute a recommendation to buy or sell any stock, and does not take account of your objectives, or your financial situation. We aim to bring you long-term focused analysis driven by fundamental data. Note that our analysis may not factor in the latest price-sensitive company announcements or qualitative material. Simply Wall St has no position in any stocks mentioned.
Have feedback on this article? Concerned about the content? Get in touch with us directly. Alternatively, email editorial-team@simplywallst.com
