
 Yahoo Finance
 John Bean Technologies (NYSE:JBT) Will Be Hoping To Turn Its Returns On Capital Around
If we want to find a stock that could multiply over the long term, what are the underlying trends we should look for? Ideally, a business will show two trends; firstly a growing return on capital employed (ROCE) and secondly, an increasing amount of capital employed. This shows us that it's a compounding machine, able to continually reinvest its earnings back into the business and generate higher returns. However, after briefly looking over the numbers, we don't think John Bean Technologies (NYSE:JBT) has the makings of a multi-bagger going forward, but let's have a look at why that may be.
Understanding Return On Capital Employed (ROCE)
Just to clarify if you're unsure, ROCE is a metric for evaluating how much pre-tax income (in percentage terms) a company earns on the capital invested in its business. To calculate this metric for John Bean Technologies, this is the formula:
Return on Capital Employed = Earnings Before Interest and Tax (EBIT) ÷ (Total Assets - Current Liabilities)
0.12 = US$179m ÷ (US$2.0b - US$479m) (Based on the trailing twelve months to June 2021).
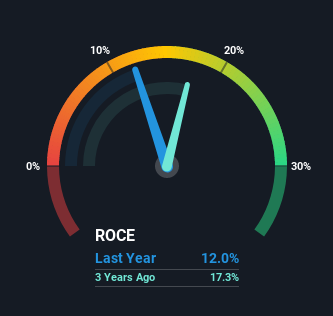
Thus, John Bean Technologies has an ROCE of 12%. On its own, that's a standard return, however it's much better than the 9.5% generated by the Machinery industry.
See our latest analysis for John Bean Technologies
Above you can see how the current ROCE for John Bean Technologies compares to its prior returns on capital, but there's only so much you can tell from the past. If you'd like, you can check out the forecasts from the analysts covering John Bean Technologies here for free.
What Does the ROCE Trend For John Bean Technologies Tell Us?
When we looked at the ROCE trend at John Bean Technologies, we didn't gain much confidence. Around five years ago the returns on capital were 18%, but since then they've fallen to 12%. However it looks like John Bean Technologies might be reinvesting for long term growth because while capital employed has increased, the company's sales haven't changed much in the last 12 months. It may take some time before the company starts to see any change in earnings from these investments.
On a side note, John Bean Technologies has done well to pay down its current liabilities to 24% of total assets. That could partly explain why the ROCE has dropped. What's more, this can reduce some aspects of risk to the business because now the company's suppliers or short-term creditors are funding less of its operations. Since the business is basically funding more of its operations with it's own money, you could argue this has made the business less efficient at generating ROCE.
In Conclusion...
In summary, John Bean Technologies is reinvesting funds back into the business for growth but unfortunately it looks like sales haven't increased much just yet. Yet to long term shareholders the stock has gifted them an incredible 101% return in the last five years, so the market appears to be rosy about its future. However, unless these underlying trends turn more positive, we wouldn't get our hopes up too high.
If you'd like to know about the risks facing John Bean Technologies, we've discovered 1 warning sign that you should be aware of.
For those who like to invest in solid companies, check out this free list of companies with solid balance sheets and high returns on equity.
This article by Simply Wall St is general in nature. We provide commentary based on historical data and analyst forecasts only using an unbiased methodology and our articles are not intended to be financial advice. It does not constitute a recommendation to buy or sell any stock, and does not take account of your objectives, or your financial situation. We aim to bring you long-term focused analysis driven by fundamental data. Note that our analysis may not factor in the latest price-sensitive company announcements or qualitative material. Simply Wall St has no position in any stocks mentioned.
Have feedback on this article? Concerned about the content? Get in touch with us directly. Alternatively, email editorial-team (at) simplywallst.com.
