
 Yahoo Finance
 John Bean Technologies Corporation's (NYSE:JBT) Fundamentals Look Pretty Strong: Could The Market Be Wrong About The Stock?
John Bean Technologies (NYSE:JBT) has had a rough month with its share price down 3.9%. But if you pay close attention, you might gather that its strong financials could mean that the stock could potentially see an increase in value in the long-term, given how markets usually reward companies with good financial health. Specifically, we decided to study John Bean Technologies' ROE in this article.
Return on equity or ROE is an important factor to be considered by a shareholder because it tells them how effectively their capital is being reinvested. In short, ROE shows the profit each dollar generates with respect to its shareholder investments.
See our latest analysis for John Bean Technologies
How To Calculate Return On Equity?
ROE can be calculated by using the formula:
Return on Equity = Net Profit (from continuing operations) ÷ Shareholders' Equity
So, based on the above formula, the ROE for John Bean Technologies is:
17% = US$117m ÷ US$707m (Based on the trailing twelve months to September 2021).
The 'return' is the amount earned after tax over the last twelve months. So, this means that for every $1 of its shareholder's investments, the company generates a profit of $0.17.
What Is The Relationship Between ROE And Earnings Growth?
We have already established that ROE serves as an efficient profit-generating gauge for a company's future earnings. We now need to evaluate how much profit the company reinvests or "retains" for future growth which then gives us an idea about the growth potential of the company. Generally speaking, other things being equal, firms with a high return on equity and profit retention, have a higher growth rate than firms that don’t share these attributes.
A Side By Side comparison of John Bean Technologies' Earnings Growth And 17% ROE
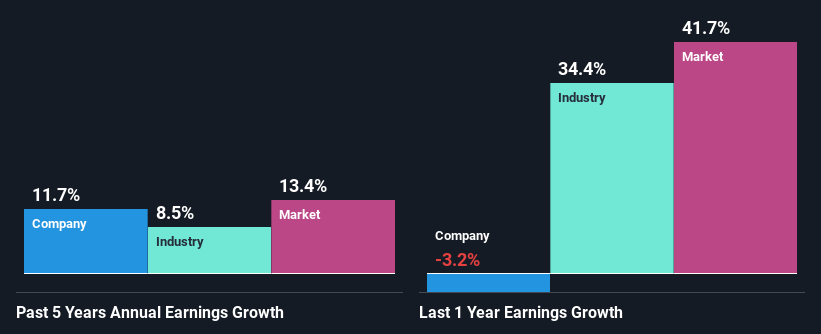
To begin with, John Bean Technologies seems to have a respectable ROE. Further, the company's ROE compares quite favorably to the industry average of 10%. This probably laid the ground for John Bean Technologies' moderate 12% net income growth seen over the past five years.
We then compared John Bean Technologies' net income growth with the industry and we're pleased to see that the company's growth figure is higher when compared with the industry which has a growth rate of 8.5% in the same period.
The basis for attaching value to a company is, to a great extent, tied to its earnings growth. The investor should try to establish if the expected growth or decline in earnings, whichever the case may be, is priced in. This then helps them determine if the stock is placed for a bright or bleak future. Has the market priced in the future outlook for JBT? You can find out in our latest intrinsic value infographic research report.
Is John Bean Technologies Efficiently Re-investing Its Profits?
John Bean Technologies' three-year median payout ratio to shareholders is 11% (implying that it retains 89% of its income), which is on the lower side, so it seems like the management is reinvesting profits heavily to grow its business.
Additionally, John Bean Technologies has paid dividends over a period of at least ten years which means that the company is pretty serious about sharing its profits with shareholders. Existing analyst estimates suggest that the company's future payout ratio is expected to drop to 5.8% over the next three years. The fact that the company's ROE is expected to rise to 21% over the same period is explained by the drop in the payout ratio.
Conclusion
On the whole, we feel that John Bean Technologies' performance has been quite good. Particularly, we like that the company is reinvesting heavily into its business, and at a high rate of return. Unsurprisingly, this has led to an impressive earnings growth. That being so, the latest analyst forecasts show that the company will continue to see an expansion in its earnings. Are these analysts expectations based on the broad expectations for the industry, or on the company's fundamentals? Click here to be taken to our analyst's forecasts page for the company.
Have feedback on this article? Concerned about the content? Get in touch with us directly. Alternatively, email editorial-team (at) simplywallst.com.
This article by Simply Wall St is general in nature. We provide commentary based on historical data and analyst forecasts only using an unbiased methodology and our articles are not intended to be financial advice. It does not constitute a recommendation to buy or sell any stock, and does not take account of your objectives, or your financial situation. We aim to bring you long-term focused analysis driven by fundamental data. Note that our analysis may not factor in the latest price-sensitive company announcements or qualitative material. Simply Wall St has no position in any stocks mentioned.
