
 Yahoo Finance
 John B. Sanfilippo & Son, Inc.'s (NASDAQ:JBSS) Recent Stock Performance Looks Decent- Can Strong Fundamentals Be the Reason?
John B. Sanfilippo & Son's (NASDAQ:JBSS) stock is up by 5.0% over the past month. Since the market usually pay for a company’s long-term financial health, we decided to study the company’s fundamentals to see if they could be influencing the market. In this article, we decided to focus on John B. Sanfilippo & Son's ROE.
Return on Equity or ROE is a test of how effectively a company is growing its value and managing investors’ money. Simply put, it is used to assess the profitability of a company in relation to its equity capital.
See our latest analysis for John B. Sanfilippo & Son
How To Calculate Return On Equity?
The formula for return on equity is:
Return on Equity = Net Profit (from continuing operations) ÷ Shareholders' Equity
So, based on the above formula, the ROE for John B. Sanfilippo & Son is:
22% = US$67m ÷ US$307m (Based on the trailing twelve months to December 2023).
The 'return' is the yearly profit. One way to conceptualize this is that for each $1 of shareholders' capital it has, the company made $0.22 in profit.
What Is The Relationship Between ROE And Earnings Growth?
Thus far, we have learned that ROE measures how efficiently a company is generating its profits. Depending on how much of these profits the company reinvests or "retains", and how effectively it does so, we are then able to assess a company’s earnings growth potential. Generally speaking, other things being equal, firms with a high return on equity and profit retention, have a higher growth rate than firms that don’t share these attributes.
John B. Sanfilippo & Son's Earnings Growth And 22% ROE
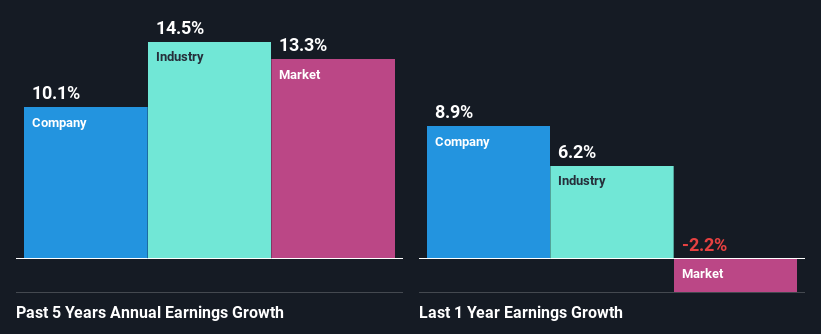
To begin with, John B. Sanfilippo & Son seems to have a respectable ROE. On comparing with the average industry ROE of 14% the company's ROE looks pretty remarkable. This certainly adds some context to John B. Sanfilippo & Son's decent 10% net income growth seen over the past five years.
As a next step, we compared John B. Sanfilippo & Son's net income growth with the industry and were disappointed to see that the company's growth is lower than the industry average growth of 15% in the same period.
Earnings growth is an important metric to consider when valuing a stock. What investors need to determine next is if the expected earnings growth, or the lack of it, is already built into the share price. This then helps them determine if the stock is placed for a bright or bleak future. If you're wondering about John B. Sanfilippo & Son's's valuation, check out this gauge of its price-to-earnings ratio, as compared to its industry.
Is John B. Sanfilippo & Son Efficiently Re-investing Its Profits?
In John B. Sanfilippo & Son's case, its respectable earnings growth can probably be explained by its low three-year median payout ratio of 14% (or a retention ratio of 86%), which suggests that the company is investing most of its profits to grow its business.
Moreover, John B. Sanfilippo & Son is determined to keep sharing its profits with shareholders which we infer from its long history of paying a dividend for at least ten years.
Summary
On the whole, we feel that John B. Sanfilippo & Son's performance has been quite good. In particular, it's great to see that the company is investing heavily into its business and along with a high rate of return, that has resulted in a respectable growth in its earnings. If the company continues to grow its earnings the way it has, that could have a positive impact on its share price given how earnings per share influence long-term share prices. Let's not forget, business risk is also one of the factors that affects the price of the stock. So this is also an important area that investors need to pay attention to before making a decision on any business. To know the 1 risk we have identified for John B. Sanfilippo & Son visit our risks dashboard for free.
Have feedback on this article? Concerned about the content? Get in touch with us directly. Alternatively, email editorial-team (at) simplywallst.com.
This article by Simply Wall St is general in nature. We provide commentary based on historical data and analyst forecasts only using an unbiased methodology and our articles are not intended to be financial advice. It does not constitute a recommendation to buy or sell any stock, and does not take account of your objectives, or your financial situation. We aim to bring you long-term focused analysis driven by fundamental data. Note that our analysis may not factor in the latest price-sensitive company announcements or qualitative material. Simply Wall St has no position in any stocks mentioned.
