
 Yahoo Finance
 As Jack in the Box (NASDAQ:JACK) rallies 8.0% this past week, investors may now be noticing the company's five-year earnings growth
In order to justify the effort of selecting individual stocks, it's worth striving to beat the returns from a market index fund. But in any portfolio, there will be mixed results between individual stocks. So we wouldn't blame long term Jack in the Box Inc. (NASDAQ:JACK) shareholders for doubting their decision to hold, with the stock down 20% over a half decade. On the other hand the share price has bounced 8.0% over the last week.
While the stock has risen 8.0% in the past week but long term shareholders are still in the red, let's see what the fundamentals can tell us.
View our latest analysis for Jack in the Box
There is no denying that markets are sometimes efficient, but prices do not always reflect underlying business performance. By comparing earnings per share (EPS) and share price changes over time, we can get a feel for how investor attitudes to a company have morphed over time.
During the unfortunate half decade during which the share price slipped, Jack in the Box actually saw its earnings per share (EPS) improve by 5.8% per year. Given the share price reaction, one might suspect that EPS is not a good guide to the business performance during the period (perhaps due to a one-off loss or gain). Or possibly, the market was previously very optimistic, so the stock has disappointed, despite improving EPS.
It's strange to see such muted share price performance despite sustained growth. Perhaps a clue lies in other metrics.
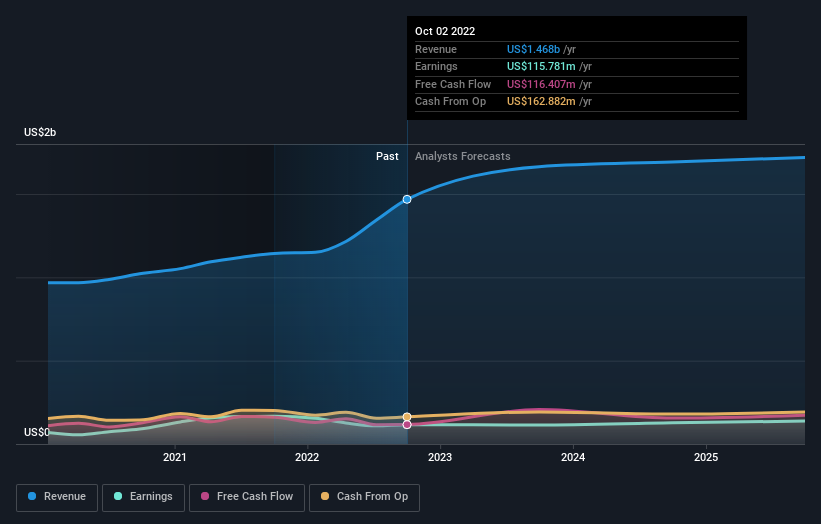
Revenue is actually up 7.1% over the time period. So it seems one might have to take closer look at the fundamentals to understand why the share price languishes. After all, there may be an opportunity.
You can see how earnings and revenue have changed over time in the image below (click on the chart to see the exact values).
Jack in the Box is well known by investors, and plenty of clever analysts have tried to predict the future profit levels. If you are thinking of buying or selling Jack in the Box stock, you should check out this free report showing analyst consensus estimates for future profits.
What About Dividends?
As well as measuring the share price return, investors should also consider the total shareholder return (TSR). Whereas the share price return only reflects the change in the share price, the TSR includes the value of dividends (assuming they were reinvested) and the benefit of any discounted capital raising or spin-off. So for companies that pay a generous dividend, the TSR is often a lot higher than the share price return. In the case of Jack in the Box, it has a TSR of -12% for the last 5 years. That exceeds its share price return that we previously mentioned. This is largely a result of its dividend payments!
A Different Perspective
Jack in the Box shareholders are down 18% over twelve months (even including dividends), which isn't far from the market return of -19%. So last year was actually even worse than the last five years, which cost shareholders 2% per year. Weak performance over the long term usually destroys market confidence in a stock, but bargain hunters may want to take a closer look for signs of a turnaround. It's always interesting to track share price performance over the longer term. But to understand Jack in the Box better, we need to consider many other factors. For instance, we've identified 3 warning signs for Jack in the Box (1 can't be ignored) that you should be aware of.
We will like Jack in the Box better if we see some big insider buys. While we wait, check out this free list of growing companies with considerable, recent, insider buying.
Please note, the market returns quoted in this article reflect the market weighted average returns of stocks that currently trade on US exchanges.
Have feedback on this article? Concerned about the content? Get in touch with us directly. Alternatively, email editorial-team (at) simplywallst.com.
This article by Simply Wall St is general in nature. We provide commentary based on historical data and analyst forecasts only using an unbiased methodology and our articles are not intended to be financial advice. It does not constitute a recommendation to buy or sell any stock, and does not take account of your objectives, or your financial situation. We aim to bring you long-term focused analysis driven by fundamental data. Note that our analysis may not factor in the latest price-sensitive company announcements or qualitative material. Simply Wall St has no position in any stocks mentioned.
Join A Paid User Research Session
You’ll receive a US$30 Amazon Gift card for 1 hour of your time while helping us build better investing tools for the individual investors like yourself. Sign up here
