
 Yahoo Finance
 J Sainsbury (LON:SBRY) Has Some Way To Go To Become A Multi-Bagger
If we want to find a stock that could multiply over the long term, what are the underlying trends we should look for? Typically, we'll want to notice a trend of growing return on capital employed (ROCE) and alongside that, an expanding base of capital employed. Ultimately, this demonstrates that it's a business that is reinvesting profits at increasing rates of return. However, after briefly looking over the numbers, we don't think J Sainsbury (LON:SBRY) has the makings of a multi-bagger going forward, but let's have a look at why that may be.
What Is Return On Capital Employed (ROCE)?
Just to clarify if you're unsure, ROCE is a metric for evaluating how much pre-tax income (in percentage terms) a company earns on the capital invested in its business. To calculate this metric for J Sainsbury, this is the formula:
Return on Capital Employed = Earnings Before Interest and Tax (EBIT) ÷ (Total Assets - Current Liabilities)
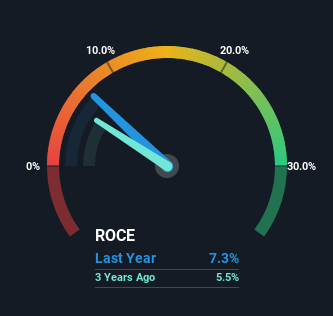
0.073 = UK£990m ÷ (UK£25b - UK£11b) (Based on the trailing twelve months to March 2024).
Thus, J Sainsbury has an ROCE of 7.3%. Ultimately, that's a low return and it under-performs the Consumer Retailing industry average of 16%.
See our latest analysis for J Sainsbury
In the above chart we have measured J Sainsbury's prior ROCE against its prior performance, but the future is arguably more important. If you'd like to see what analysts are forecasting going forward, you should check out our free analyst report for J Sainsbury .
How Are Returns Trending?
There hasn't been much to report for J Sainsbury's returns and its level of capital employed because both metrics have been steady for the past five years. It's not uncommon to see this when looking at a mature and stable business that isn't re-investing its earnings because it has likely passed that phase of the business cycle. So don't be surprised if J Sainsbury doesn't end up being a multi-bagger in a few years time. With fewer investment opportunities, it makes sense that J Sainsbury has been paying out a decent 57% of its earnings to shareholders. Given the business isn't reinvesting in itself, it makes sense to distribute a portion of earnings among shareholders.
Another thing to note, J Sainsbury has a high ratio of current liabilities to total assets of 46%. This effectively means that suppliers (or short-term creditors) are funding a large portion of the business, so just be aware that this can introduce some elements of risk. While it's not necessarily a bad thing, it can be beneficial if this ratio is lower.
Our Take On J Sainsbury's ROCE
In summary, J Sainsbury isn't compounding its earnings but is generating stable returns on the same amount of capital employed. Although the market must be expecting these trends to improve because the stock has gained 80% over the last five years. However, unless these underlying trends turn more positive, we wouldn't get our hopes up too high.
If you'd like to know more about J Sainsbury, we've spotted 3 warning signs, and 1 of them makes us a bit uncomfortable.
For those who like to invest in solid companies, check out this free list of companies with solid balance sheets and high returns on equity.
Have feedback on this article? Concerned about the content? Get in touch with us directly. Alternatively, email editorial-team (at) simplywallst.com.
This article by Simply Wall St is general in nature. We provide commentary based on historical data and analyst forecasts only using an unbiased methodology and our articles are not intended to be financial advice. It does not constitute a recommendation to buy or sell any stock, and does not take account of your objectives, or your financial situation. We aim to bring you long-term focused analysis driven by fundamental data. Note that our analysis may not factor in the latest price-sensitive company announcements or qualitative material. Simply Wall St has no position in any stocks mentioned.