
 Yahoo Finance
 The J. M. Smucker Company (NYSE:SJM): Is It A Good Long Term Opportunity?

Want to participate in a short research study? Help shape the future of investing tools and you could win a $250 gift card!
In April 2019, The J. M. Smucker Company (NYSE:SJM) announced its most recent earnings update, which confirmed that the business endured a immense headwind with earnings deteriorating by -62%. Below, I've laid out key growth figures on how market analysts view J. M. Smucker's earnings growth outlook over the next few years and whether the future looks brighter. I will be using net income excluding extraordinary items in order to exclude one-off volatility which I am not interested in.
View our latest analysis for J. M. Smucker
Analysts' outlook for the coming year seems buoyant, with earnings climbing by a significant 52%. This high growth in earnings is expected to continue, bringing the bottom line up to US$1.1b by 2022.
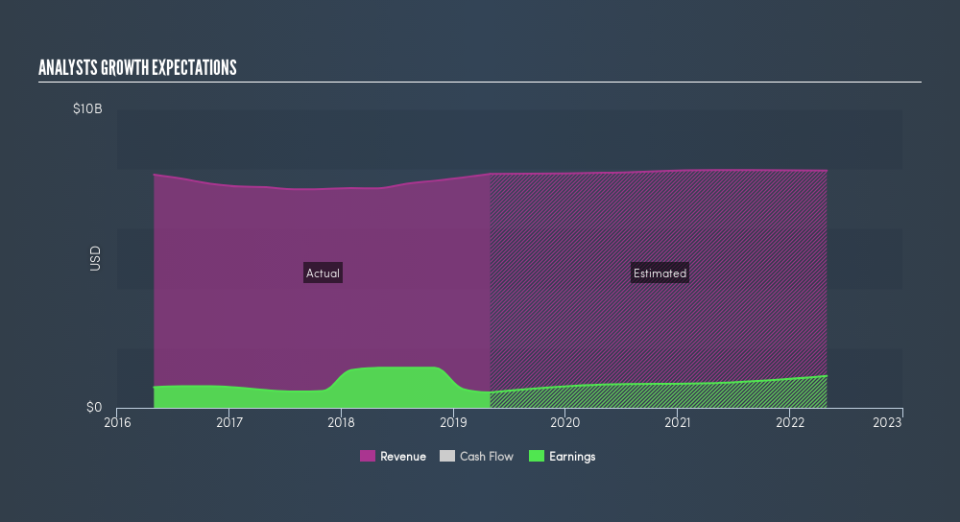
Although it’s informative understanding the growth each year relative to today’s level, it may be more valuable to determine the rate at which the company is growing every year, on average. The pro of this method is that it removes the impact of near term flucuations and accounts for the overarching direction of J. M. Smucker's earnings trajectory over time, which may be more relevant for long term investors. To compute this rate, I put a line of best fit through analyst consensus of forecasted earnings. The slope of this line is the rate of earnings growth, which in this case is 21%. This means that, we can presume J. M. Smucker will grow its earnings by 21% every year for the next few years.
Next Steps:
For J. M. Smucker, I've compiled three relevant factors you should further examine:
Financial Health: Does it have a healthy balance sheet? Take a look at our free balance sheet analysis with six simple checks on key factors like leverage and risk.
Valuation: What is SJM worth today? Is the stock undervalued, even when its growth outlook is factored into its intrinsic value? The intrinsic value infographic in our free research report helps visualize whether SJM is currently mispriced by the market.
Other High-Growth Alternatives: Are there other high-growth stocks you could be holding instead of SJM? Explore our interactive list of stocks with large growth potential to get an idea of what else is out there you may be missing!
We aim to bring you long-term focused research analysis driven by fundamental data. Note that our analysis may not factor in the latest price-sensitive company announcements or qualitative material.
If you spot an error that warrants correction, please contact the editor at editorial-team@simplywallst.com. This article by Simply Wall St is general in nature. It does not constitute a recommendation to buy or sell any stock, and does not take account of your objectives, or your financial situation. Simply Wall St has no position in the stocks mentioned. Thank you for reading.
