
 Yahoo Finance
 Has IVE Group Limited's (ASX:IGL) Impressive Stock Performance Got Anything to Do With Its Fundamentals?
IVE Group's (ASX:IGL) stock is up by a considerable 12% over the past three months. Given that stock prices are usually aligned with a company's financial performance in the long-term, we decided to study its financial indicators more closely to see if they had a hand to play in the recent price move. Specifically, we decided to study IVE Group's ROE in this article.
Return on equity or ROE is a key measure used to assess how efficiently a company's management is utilizing the company's capital. Simply put, it is used to assess the profitability of a company in relation to its equity capital.
See our latest analysis for IVE Group
How Do You Calculate Return On Equity?
ROE can be calculated by using the formula:
Return on Equity = Net Profit (from continuing operations) ÷ Shareholders' Equity
So, based on the above formula, the ROE for IVE Group is:
14% = AU$25m ÷ AU$177m (Based on the trailing twelve months to June 2021).
The 'return' is the yearly profit. Another way to think of that is that for every A$1 worth of equity, the company was able to earn A$0.14 in profit.
What Is The Relationship Between ROE And Earnings Growth?
Thus far, we have learned that ROE measures how efficiently a company is generating its profits. Based on how much of its profits the company chooses to reinvest or "retain", we are then able to evaluate a company's future ability to generate profits. Assuming all else is equal, companies that have both a higher return on equity and higher profit retention are usually the ones that have a higher growth rate when compared to companies that don't have the same features.
IVE Group's Earnings Growth And 14% ROE
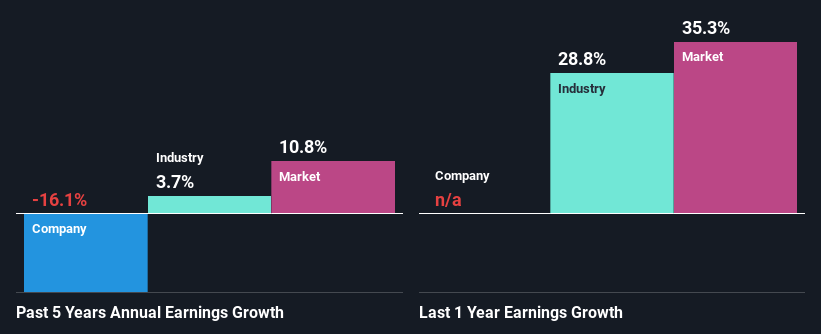
To start with, IVE Group's ROE looks acceptable. And on comparing with the industry, we found that the the average industry ROE is similar at 14%. However, while IVE Group has a pretty respectable ROE, its five year net income decline rate was 16% . So, there might be some other aspects that could explain this. These include low earnings retention or poor allocation of capital.
So, as a next step, we compared IVE Group's performance against the industry and were disappointed to discover that while the company has been shrinking its earnings, the industry has been growing its earnings at a rate of 3.7% in the same period.
Earnings growth is an important metric to consider when valuing a stock. What investors need to determine next is if the expected earnings growth, or the lack of it, is already built into the share price. This then helps them determine if the stock is placed for a bright or bleak future. Has the market priced in the future outlook for IGL? You can find out in our latest intrinsic value infographic research report.
Is IVE Group Efficiently Re-investing Its Profits?
With a high three-year median payout ratio of 81% (implying that 19% of the profits are retained), most of IVE Group's profits are being paid to shareholders, which explains the company's shrinking earnings. The business is only left with a small pool of capital to reinvest - A vicious cycle that doesn't benefit the company in the long-run. You can see the 2 risks we have identified for IVE Group by visiting our risks dashboard for free on our platform here.
In addition, IVE Group has been paying dividends over a period of five years suggesting that keeping up dividend payments is preferred by the management even though earnings have been in decline. Our latest analyst data shows that the future payout ratio of the company is expected to drop to 64% over the next three years. The fact that the company's ROE is expected to rise to 17% over the same period is explained by the drop in the payout ratio.
Conclusion
Overall, we feel that IVE Group certainly does have some positive factors to consider. However, while the company does have a high ROE, its earnings growth number is quite disappointing. This can be blamed on the fact that it reinvests only a small portion of its profits and pays out the rest as dividends. With that said, we studied the latest analyst forecasts and found that while the company has shrunk its earnings in the past, analysts expect its earnings to grow in the future. To know more about the latest analysts predictions for the company, check out this visualization of analyst forecasts for the company.
This article by Simply Wall St is general in nature. We provide commentary based on historical data and analyst forecasts only using an unbiased methodology and our articles are not intended to be financial advice. It does not constitute a recommendation to buy or sell any stock, and does not take account of your objectives, or your financial situation. We aim to bring you long-term focused analysis driven by fundamental data. Note that our analysis may not factor in the latest price-sensitive company announcements or qualitative material. Simply Wall St has no position in any stocks mentioned.
Have feedback on this article? Concerned about the content? Get in touch with us directly. Alternatively, email editorial-team (at) simplywallst.com.
