
 Yahoo Finance
 Itim Group Plc's (LON:ITIM) Subdued P/S Might Signal An Opportunity
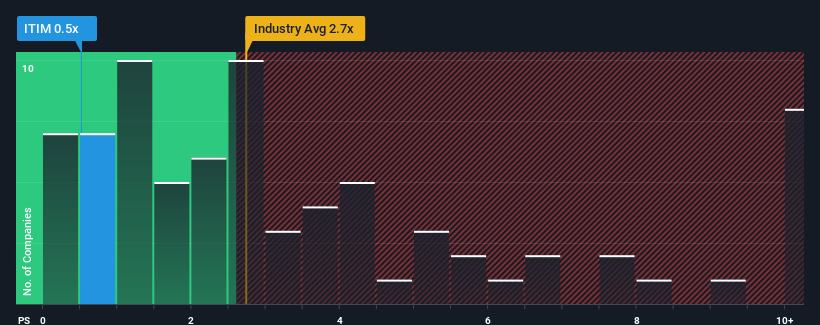
You may think that with a price-to-sales (or "P/S") ratio of 0.5x Itim Group Plc (LON:ITIM) is definitely a stock worth checking out, seeing as almost half of all the Software companies in the United Kingdom have P/S ratios greater than 2.7x and even P/S above 6x aren't out of the ordinary. Although, it's not wise to just take the P/S at face value as there may be an explanation why it's so limited.
See our latest analysis for Itim Group
How Has Itim Group Performed Recently?
Recent times haven't been great for Itim Group as its revenue has been rising slower than most other companies. It seems that many are expecting the uninspiring revenue performance to persist, which has repressed the growth of the P/S ratio. If you still like the company, you'd be hoping revenue doesn't get any worse and that you could pick up some stock while it's out of favour.
If you'd like to see what analysts are forecasting going forward, you should check out our free report on Itim Group.
Do Revenue Forecasts Match The Low P/S Ratio?
In order to justify its P/S ratio, Itim Group would need to produce anemic growth that's substantially trailing the industry.
Retrospectively, the last year delivered a decent 4.2% gain to the company's revenues. The latest three year period has also seen a 20% overall rise in revenue, aided somewhat by its short-term performance. Accordingly, shareholders would have probably been satisfied with the medium-term rates of revenue growth.
Turning to the outlook, the next three years should generate growth of 14% each year as estimated by the lone analyst watching the company. With the industry only predicted to deliver 9.5% each year, the company is positioned for a stronger revenue result.
With this in consideration, we find it intriguing that Itim Group's P/S sits behind most of its industry peers. Apparently some shareholders are doubtful of the forecasts and have been accepting significantly lower selling prices.
The Key Takeaway
While the price-to-sales ratio shouldn't be the defining factor in whether you buy a stock or not, it's quite a capable barometer of revenue expectations.
To us, it seems Itim Group currently trades on a significantly depressed P/S given its forecasted revenue growth is higher than the rest of its industry. The reason for this depressed P/S could potentially be found in the risks the market is pricing in. It appears the market could be anticipating revenue instability, because these conditions should normally provide a boost to the share price.
We don't want to rain on the parade too much, but we did also find 3 warning signs for Itim Group (2 are concerning!) that you need to be mindful of.
If these risks are making you reconsider your opinion on Itim Group, explore our interactive list of high quality stocks to get an idea of what else is out there.
Have feedback on this article? Concerned about the content? Get in touch with us directly. Alternatively, email editorial-team (at) simplywallst.com.
This article by Simply Wall St is general in nature. We provide commentary based on historical data and analyst forecasts only using an unbiased methodology and our articles are not intended to be financial advice. It does not constitute a recommendation to buy or sell any stock, and does not take account of your objectives, or your financial situation. We aim to bring you long-term focused analysis driven by fundamental data. Note that our analysis may not factor in the latest price-sensitive company announcements or qualitative material. Simply Wall St has no position in any stocks mentioned.
Join A Paid User Research Session
You’ll receive a US$30 Amazon Gift card for 1 hour of your time while helping us build better investing tools for the individual investors like yourself. Sign up here
