
 Yahoo Finance
 IPG Photonics (NASDAQ:IPGP) Will Be Looking To Turn Around Its Returns
If you're looking at a mature business that's past the growth phase, what are some of the underlying trends that pop up? A business that's potentially in decline often shows two trends, a return on capital employed (ROCE) that's declining, and a base of capital employed that's also declining. Basically the company is earning less on its investments and it is also reducing its total assets. And from a first read, things don't look too good at IPG Photonics (NASDAQ:IPGP), so let's see why.
What Is Return On Capital Employed (ROCE)?
For those that aren't sure what ROCE is, it measures the amount of pre-tax profits a company can generate from the capital employed in its business. To calculate this metric for IPG Photonics, this is the formula:
Return on Capital Employed = Earnings Before Interest and Tax (EBIT) ÷ (Total Assets - Current Liabilities)
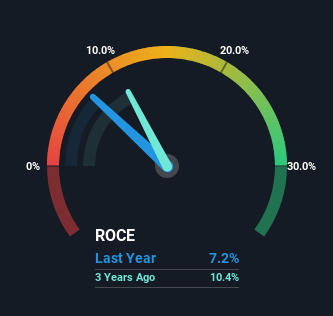
0.072 = US$173m ÷ (US$2.6b - US$192m) (Based on the trailing twelve months to March 2024).
Therefore, IPG Photonics has an ROCE of 7.2%. In absolute terms, that's a low return and it also under-performs the Electronic industry average of 11%.
View our latest analysis for IPG Photonics
In the above chart we have measured IPG Photonics' prior ROCE against its prior performance, but the future is arguably more important. If you'd like to see what analysts are forecasting going forward, you should check out our free analyst report for IPG Photonics .
So How Is IPG Photonics' ROCE Trending?
We are a bit worried about the trend of returns on capital at IPG Photonics. To be more specific, the ROCE was 19% five years ago, but since then it has dropped noticeably. On top of that, it's worth noting that the amount of capital employed within the business has remained relatively steady. This combination can be indicative of a mature business that still has areas to deploy capital, but the returns received aren't as high due potentially to new competition or smaller margins. So because these trends aren't typically conducive to creating a multi-bagger, we wouldn't hold our breath on IPG Photonics becoming one if things continue as they have.
What We Can Learn From IPG Photonics' ROCE
In the end, the trend of lower returns on the same amount of capital isn't typically an indication that we're looking at a growth stock. It should come as no surprise then that the stock has fallen 32% over the last five years, so it looks like investors are recognizing these changes. That being the case, unless the underlying trends revert to a more positive trajectory, we'd consider looking elsewhere.
While IPG Photonics doesn't shine too bright in this respect, it's still worth seeing if the company is trading at attractive prices. You can find that out with our FREE intrinsic value estimation for IPGP on our platform.
While IPG Photonics isn't earning the highest return, check out this free list of companies that are earning high returns on equity with solid balance sheets.
Have feedback on this article? Concerned about the content? Get in touch with us directly. Alternatively, email editorial-team (at) simplywallst.com.
This article by Simply Wall St is general in nature. We provide commentary based on historical data and analyst forecasts only using an unbiased methodology and our articles are not intended to be financial advice. It does not constitute a recommendation to buy or sell any stock, and does not take account of your objectives, or your financial situation. We aim to bring you long-term focused analysis driven by fundamental data. Note that our analysis may not factor in the latest price-sensitive company announcements or qualitative material. Simply Wall St has no position in any stocks mentioned.
