
 Yahoo Finance
 Investors in Zuora (NYSE:ZUO) from three years ago are still down 45%, even after 4.4% gain this past week
Zuora, Inc. (NYSE:ZUO) shareholders should be happy to see the share price up 13% in the last quarter. But that doesn't change the fact that the returns over the last three years have been less than pleasing. After all, the share price is down 45% in the last three years, significantly under-performing the market.
On a more encouraging note the company has added US$61m to its market cap in just the last 7 days, so let's see if we can determine what's driven the three-year loss for shareholders.
View our latest analysis for Zuora
Because Zuora made a loss in the last twelve months, we think the market is probably more focussed on revenue and revenue growth, at least for now. When a company doesn't make profits, we'd generally hope to see good revenue growth. Some companies are willing to postpone profitability to grow revenue faster, but in that case one would hope for good top-line growth to make up for the lack of earnings.
Over three years, Zuora grew revenue at 11% per year. That's a fairly respectable growth rate. Shareholders have endured a share price decline of 13% per year. This implies the market had higher expectations of Zuora. With revenue growing at a solid clip, now might be the time to focus on the possibility that it will have a brighter future.
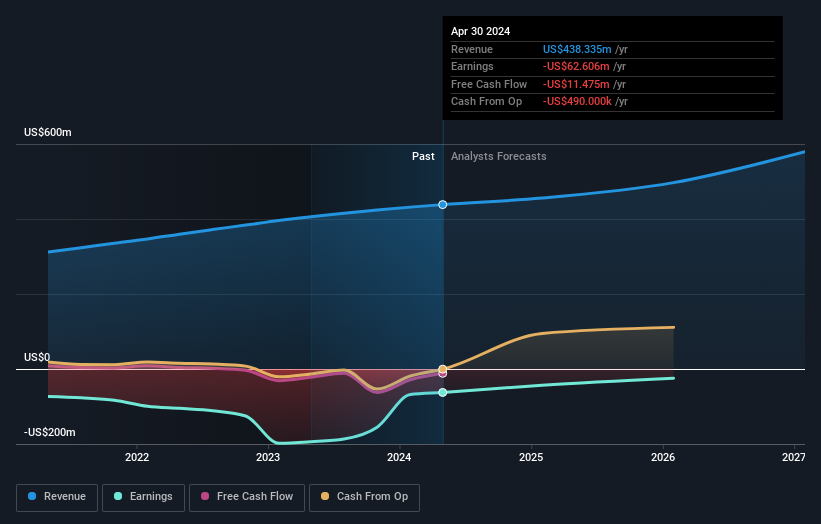
The company's revenue and earnings (over time) are depicted in the image below (click to see the exact numbers).
You can see how its balance sheet has strengthened (or weakened) over time in this free interactive graphic.
A Different Perspective
Zuora shareholders are down 4.6% for the year, but the market itself is up 25%. Even the share prices of good stocks drop sometimes, but we want to see improvements in the fundamental metrics of a business, before getting too interested. Unfortunately, longer term shareholders are suffering worse, given the loss of 7% doled out over the last five years. We'd need to see some sustained improvements in the key metrics before we could muster much enthusiasm. I find it very interesting to look at share price over the long term as a proxy for business performance. But to truly gain insight, we need to consider other information, too. Even so, be aware that Zuora is showing 3 warning signs in our investment analysis , you should know about...
Of course Zuora may not be the best stock to buy. So you may wish to see this free collection of growth stocks.
Please note, the market returns quoted in this article reflect the market weighted average returns of stocks that currently trade on American exchanges.
Have feedback on this article? Concerned about the content? Get in touch with us directly. Alternatively, email editorial-team (at) simplywallst.com.
This article by Simply Wall St is general in nature. We provide commentary based on historical data and analyst forecasts only using an unbiased methodology and our articles are not intended to be financial advice. It does not constitute a recommendation to buy or sell any stock, and does not take account of your objectives, or your financial situation. We aim to bring you long-term focused analysis driven by fundamental data. Note that our analysis may not factor in the latest price-sensitive company announcements or qualitative material. Simply Wall St has no position in any stocks mentioned.
Have feedback on this article? Concerned about the content? Get in touch with us directly. Alternatively, email editorial-team@simplywallst.com
