
 Yahoo Finance
 Investors In Whitecap Resources Inc. (TSE:WCP) Should Consider This, First
Want to participate in a short research study? Help shape the future of investing tools and you could win a $250 gift card!
Could Whitecap Resources Inc. (TSE:WCP) be an attractive dividend share to own for the long haul? Investors are often drawn to strong companies with the idea of reinvesting the dividends. Unfortunately, it's common for investors to be enticed in by the seemingly attractive yield, and lose money when the company has to cut its dividend payments.
In this case, Whitecap Resources likely looks attractive to dividend investors, given its 8.4% dividend yield and seven-year payment history. We'd agree the yield does look enticing. The company also bought back stock during the year, equivalent to approximately 1.9% of the company's market capitalisation at the time. When buying stocks for their dividends, you should always run through the checks below, to see if the dividend looks sustainable.
Explore this interactive chart for our latest analysis on Whitecap Resources!
Payout ratios
Companies (usually) pay dividends out of their earnings. If a company is paying more than it earns, the dividend might have to be cut. Comparing dividend payments to a company's net profit after tax is a simple way of reality-checking whether a dividend is sustainable. Whitecap Resources paid out 652% of its profit as dividends, over the trailing twelve month period. A payout ratio above 100% is definitely an item of concern, unless there are some other circumstances that would justify it.
In addition to comparing dividends against profits, we should inspect whether the company generated enough cash to pay its dividend. Whitecap Resources paid out a conservative 46% of its free cash flow as dividends last year. It's good to see that while Whitecap Resources's dividends were not covered by profits, at least they are affordable from a cash perspective. If executives were to continue paying more in dividends than the company reported in profits, we'd view this as a warning sign. Extraordinarily few companies are capable of persistently paying a dividend that is greater than their profits.
Is Whitecap Resources's Balance Sheet Risky?
As Whitecap Resources has a meaningful amount of debt, we need to check its balance sheet to see if the company might have debt risks. A rough way to check this is with these two simple ratios: a) net debt divided by EBITDA (earnings before interest, tax, depreciation and amortisation), and b) net interest cover. Net debt to EBITDA measures total debt load relative to company earnings (lower = less debt), while net interest cover measures the ability to pay interest on the debt (higher = greater ability to pay interest costs). Whitecap Resources has net debt of 1.53 times its EBITDA, which is generally an okay level of debt for most companies.
We calculated its interest cover by measuring its earnings before interest and tax (EBIT), and dividing this by the company's net interest expense. With EBIT of 1.74 times its interest expense, Whitecap Resources's interest cover is starting to look a bit thin.
We update our data on Whitecap Resources every 24 hours, so you can always get our latest analysis of its financial health, here.
Dividend Volatility
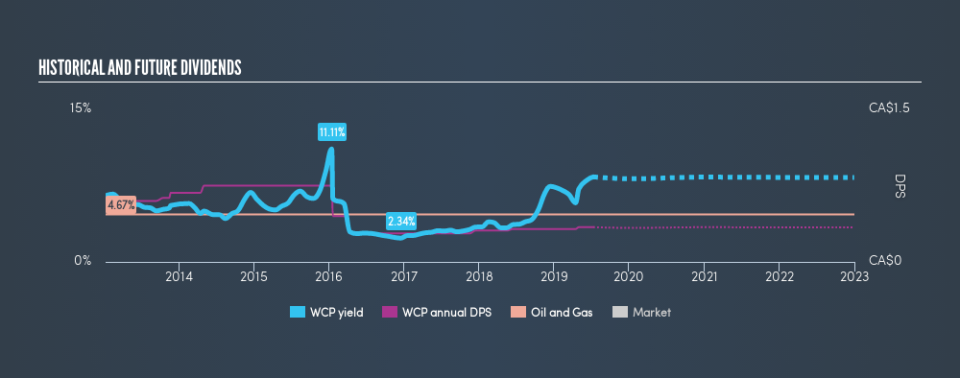
One of the major risks of relying on dividend income, is the potential for a company to struggle financially and cut its dividend. Not only is your income cut, but the value of your investment declines as well - nasty. Looking at the data, we can see that Whitecap Resources has been paying a dividend for the past seven years. During the past seven-year period, the first annual payment was CA$0.60 in 2012, compared to CA$0.34 last year. This works out to be a decline of approximately 7.7% per year over that time.
We struggle to make a case for buying Whitecap Resources for its dividend, given that payments have shrunk over the past seven years.
Dividend Growth Potential
The other half of the dividend investing equation is evaluating whether earnings per share (EPS) are growing. Growing EPS can help maintain or increase the purchasing power of the dividend over the long run. Over the past five years, it looks as though Whitecap Resources's EPS have declined at around 29% a year. If earnings continue to decline, the dividend may come under pressure. Every investor should make an assessment of whether the company is taking steps to stabilise the situation.
Conclusion
To summarise, shareholders should always check that Whitecap Resources's dividends are affordable, that its dividend payments are relatively stable, and that it has decent prospects for growing its earnings and dividend. We're not keen on the fact that Whitecap Resources paid out such a high percentage of its income, although its cashflow is in better shape. Earnings per share are down, and to our mind Whitecap Resources has not been paying a dividend long enough to demonstrate its resilience across economic cycles. With this information in mind, we think Whitecap Resources may not be an ideal dividend stock.
Without at least some growth in earnings per share over time, the dividend will eventually come under pressure either from costs or inflation. See if the 4 analysts are forecasting a turnaround in our free collection of analyst estimates here.
We have also put together a list of global stocks with a market capitalisation above $1bn and yielding more 3%.
We aim to bring you long-term focused research analysis driven by fundamental data. Note that our analysis may not factor in the latest price-sensitive company announcements or qualitative material.
If you spot an error that warrants correction, please contact the editor at editorial-team@simplywallst.com. This article by Simply Wall St is general in nature. It does not constitute a recommendation to buy or sell any stock, and does not take account of your objectives, or your financial situation. Simply Wall St has no position in the stocks mentioned. Thank you for reading.
