
 Yahoo Finance
 Investors Will Want Plan Optik's (ETR:P4O) Growth In ROCE To Persist
To find a multi-bagger stock, what are the underlying trends we should look for in a business? Ideally, a business will show two trends; firstly a growing return on capital employed (ROCE) and secondly, an increasing amount of capital employed. If you see this, it typically means it's a company with a great business model and plenty of profitable reinvestment opportunities. So on that note, Plan Optik (ETR:P4O) looks quite promising in regards to its trends of return on capital.
Return On Capital Employed (ROCE): What Is It?
Just to clarify if you're unsure, ROCE is a metric for evaluating how much pre-tax income (in percentage terms) a company earns on the capital invested in its business. The formula for this calculation on Plan Optik is:
Return on Capital Employed = Earnings Before Interest and Tax (EBIT) ÷ (Total Assets - Current Liabilities)
0.16 = €1.9m ÷ (€15m - €3.1m) (Based on the trailing twelve months to June 2022).
Thus, Plan Optik has an ROCE of 16%. By itself that's a normal return on capital and it's in line with the industry's average returns of 16%.
Check out our latest analysis for Plan Optik
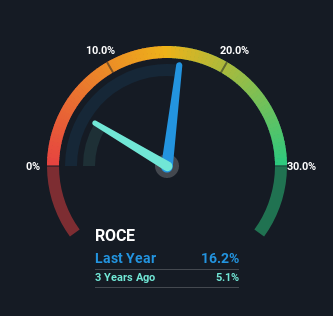
Historical performance is a great place to start when researching a stock so above you can see the gauge for Plan Optik's ROCE against it's prior returns. If you'd like to look at how Plan Optik has performed in the past in other metrics, you can view this free graph of past earnings, revenue and cash flow.
So How Is Plan Optik's ROCE Trending?
We like the trends that we're seeing from Plan Optik. Over the last five years, returns on capital employed have risen substantially to 16%. The amount of capital employed has increased too, by 45%. This can indicate that there's plenty of opportunities to invest capital internally and at ever higher rates, a combination that's common among multi-baggers.
On a side note, we noticed that the improvement in ROCE appears to be partly fueled by an increase in current liabilities. Effectively this means that suppliers or short-term creditors are now funding 21% of the business, which is more than it was five years ago. It's worth keeping an eye on this because as the percentage of current liabilities to total assets increases, some aspects of risk also increase.
The Bottom Line
A company that is growing its returns on capital and can consistently reinvest in itself is a highly sought after trait, and that's what Plan Optik has. And investors seem to expect more of this going forward, since the stock has rewarded shareholders with a 86% return over the last five years. In light of that, we think it's worth looking further into this stock because if Plan Optik can keep these trends up, it could have a bright future ahead.
If you want to continue researching Plan Optik, you might be interested to know about the 2 warning signs that our analysis has discovered.
While Plan Optik may not currently earn the highest returns, we've compiled a list of companies that currently earn more than 25% return on equity. Check out this free list here.
Have feedback on this article? Concerned about the content? Get in touch with us directly. Alternatively, email editorial-team (at) simplywallst.com.
This article by Simply Wall St is general in nature. We provide commentary based on historical data and analyst forecasts only using an unbiased methodology and our articles are not intended to be financial advice. It does not constitute a recommendation to buy or sell any stock, and does not take account of your objectives, or your financial situation. We aim to bring you long-term focused analysis driven by fundamental data. Note that our analysis may not factor in the latest price-sensitive company announcements or qualitative material. Simply Wall St has no position in any stocks mentioned.
Join A Paid User Research Session
You’ll receive a US$30 Amazon Gift card for 1 hour of your time while helping us build better investing tools for the individual investors like yourself. Sign up here
