
 Yahoo Finance
 Investors Will Want McCoy Global's (TSE:MCB) Growth In ROCE To Persist
If we want to find a stock that could multiply over the long term, what are the underlying trends we should look for? One common approach is to try and find a company with returns on capital employed (ROCE) that are increasing, in conjunction with a growing amount of capital employed. Ultimately, this demonstrates that it's a business that is reinvesting profits at increasing rates of return. So on that note, McCoy Global (TSE:MCB) looks quite promising in regards to its trends of return on capital.
Return On Capital Employed (ROCE): What is it?
For those that aren't sure what ROCE is, it measures the amount of pre-tax profits a company can generate from the capital employed in its business. Analysts use this formula to calculate it for McCoy Global:
Return on Capital Employed = Earnings Before Interest and Tax (EBIT) ÷ (Total Assets - Current Liabilities)
0.0025 = CA$116k ÷ (CA$55m - CA$8.4m) (Based on the trailing twelve months to December 2021).
So, McCoy Global has an ROCE of 0.2%. Ultimately, that's a low return and it under-performs the Energy Services industry average of 5.5%.
See our latest analysis for McCoy Global
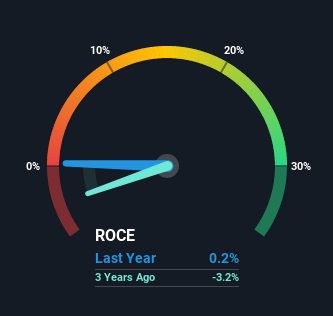
Historical performance is a great place to start when researching a stock so above you can see the gauge for McCoy Global's ROCE against it's prior returns. If you'd like to look at how McCoy Global has performed in the past in other metrics, you can view this free graph of past earnings, revenue and cash flow.
What Can We Tell From McCoy Global's ROCE Trend?
It's great to see that McCoy Global has started to generate some pre-tax earnings from prior investments. While the business is profitable now, it used to be incurring losses on invested capital five years ago. At first glance, it seems the business is getting more proficient at generating returns, because over the same period, the amount of capital employed has reduced by 26%. McCoy Global could be selling under-performing assets since the ROCE is improving.
The Key Takeaway
In a nutshell, we're pleased to see that McCoy Global has been able to generate higher returns from less capital. Given the stock has declined 54% in the last five years, this could be a good investment if the valuation and other metrics are also appealing. With that in mind, we believe the promising trends warrant this stock for further investigation.
If you want to know some of the risks facing McCoy Global we've found 3 warning signs (1 makes us a bit uncomfortable!) that you should be aware of before investing here.
If you want to search for solid companies with great earnings, check out this free list of companies with good balance sheets and impressive returns on equity.
Have feedback on this article? Concerned about the content? Get in touch with us directly. Alternatively, email editorial-team (at) simplywallst.com.
This article by Simply Wall St is general in nature. We provide commentary based on historical data and analyst forecasts only using an unbiased methodology and our articles are not intended to be financial advice. It does not constitute a recommendation to buy or sell any stock, and does not take account of your objectives, or your financial situation. We aim to bring you long-term focused analysis driven by fundamental data. Note that our analysis may not factor in the latest price-sensitive company announcements or qualitative material. Simply Wall St has no position in any stocks mentioned.
