
 Yahoo Finance
 Investors Will Want Jaguar Mining's (TSE:JAG) Growth In ROCE To Persist
To find a multi-bagger stock, what are the underlying trends we should look for in a business? Firstly, we'd want to identify a growing return on capital employed (ROCE) and then alongside that, an ever-increasing base of capital employed. Put simply, these types of businesses are compounding machines, meaning they are continually reinvesting their earnings at ever-higher rates of return. With that in mind, we've noticed some promising trends at Jaguar Mining (TSE:JAG) so let's look a bit deeper.
What Is Return On Capital Employed (ROCE)?
Just to clarify if you're unsure, ROCE is a metric for evaluating how much pre-tax income (in percentage terms) a company earns on the capital invested in its business. To calculate this metric for Jaguar Mining, this is the formula:
Return on Capital Employed = Earnings Before Interest and Tax (EBIT) ÷ (Total Assets - Current Liabilities)
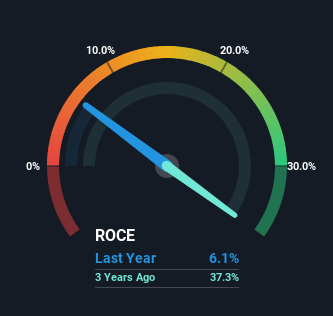
0.061 = US$17m ÷ (US$309m - US$33m) (Based on the trailing twelve months to December 2023).
So, Jaguar Mining has an ROCE of 6.1%. On its own that's a low return, but compared to the average of 1.3% generated by the Metals and Mining industry, it's much better.
View our latest analysis for Jaguar Mining
In the above chart we have measured Jaguar Mining's prior ROCE against its prior performance, but the future is arguably more important. If you're interested, you can view the analysts predictions in our free analyst report for Jaguar Mining .
What Does the ROCE Trend For Jaguar Mining Tell Us?
The fact that Jaguar Mining is now generating some pre-tax profits from its prior investments is very encouraging. The company was generating losses five years ago, but now it's earning 6.1% which is a sight for sore eyes. In addition to that, Jaguar Mining is employing 98% more capital than previously which is expected of a company that's trying to break into profitability. This can tell us that the company has plenty of reinvestment opportunities that are able to generate higher returns.
On a related note, the company's ratio of current liabilities to total assets has decreased to 11%, which basically reduces it's funding from the likes of short-term creditors or suppliers. So shareholders would be pleased that the growth in returns has mostly come from underlying business performance.
The Key Takeaway
In summary, it's great to see that Jaguar Mining has managed to break into profitability and is continuing to reinvest in its business. And a remarkable 195% total return over the last five years tells us that investors are expecting more good things to come in the future. In light of that, we think it's worth looking further into this stock because if Jaguar Mining can keep these trends up, it could have a bright future ahead.
On a final note, we've found 2 warning signs for Jaguar Mining that we think you should be aware of.
For those who like to invest in solid companies, check out this free list of companies with solid balance sheets and high returns on equity.
Have feedback on this article? Concerned about the content? Get in touch with us directly. Alternatively, email editorial-team (at) simplywallst.com.
This article by Simply Wall St is general in nature. We provide commentary based on historical data and analyst forecasts only using an unbiased methodology and our articles are not intended to be financial advice. It does not constitute a recommendation to buy or sell any stock, and does not take account of your objectives, or your financial situation. We aim to bring you long-term focused analysis driven by fundamental data. Note that our analysis may not factor in the latest price-sensitive company announcements or qualitative material. Simply Wall St has no position in any stocks mentioned.
