
 Yahoo Finance
 Investors in Viva Energy Group (ASX:VEA) have made a notable return of 41% over the past year
If you want to compound wealth in the stock market, you can do so by buying an index fund. But you can significantly boost your returns by picking above-average stocks. To wit, the Viva Energy Group Limited (ASX:VEA) share price is 33% higher than it was a year ago, much better than the market return of around 7.4% (not including dividends) in the same period. So that should have shareholders smiling. Zooming out, the stock is actually down 23% in the last three years.
So let's assess the underlying fundamentals over the last 1 year and see if they've moved in lock-step with shareholder returns.
View our latest analysis for Viva Energy Group
While the efficient markets hypothesis continues to be taught by some, it has been proven that markets are over-reactive dynamic systems, and investors are not always rational. One flawed but reasonable way to assess how sentiment around a company has changed is to compare the earnings per share (EPS) with the share price.
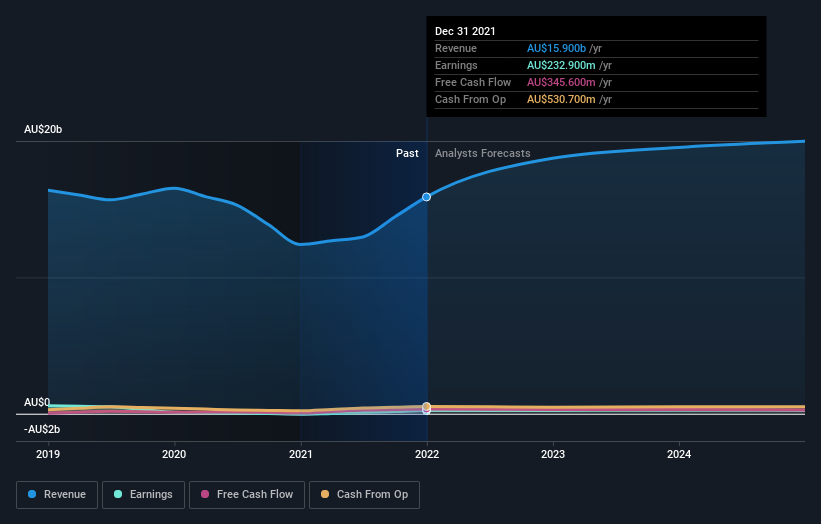
Viva Energy Group went from making a loss to reporting a profit, in the last year.
When a company is just on the edge of profitability it can be well worth considering other metrics in order to more precisely gauge growth (and therefore understand share price movements).
However the year on year revenue growth of 28% would help. Many businesses do go through a phase where they have to forgo some profits to drive business development, and sometimes its for the best.
The graphic below depicts how earnings and revenue have changed over time (unveil the exact values by clicking on the image).
Viva Energy Group is a well known stock, with plenty of analyst coverage, suggesting some visibility into future growth. If you are thinking of buying or selling Viva Energy Group stock, you should check out this free report showing analyst consensus estimates for future profits.
What About Dividends?
It is important to consider the total shareholder return, as well as the share price return, for any given stock. The TSR incorporates the value of any spin-offs or discounted capital raisings, along with any dividends, based on the assumption that the dividends are reinvested. So for companies that pay a generous dividend, the TSR is often a lot higher than the share price return. We note that for Viva Energy Group the TSR over the last 1 year was 41%, which is better than the share price return mentioned above. And there's no prize for guessing that the dividend payments largely explain the divergence!
A Different Perspective
It's nice to see that Viva Energy Group shareholders have gained 41% (in total) over the last year. That's including the dividend. So this year's TSR was actually better than the three-year TSR (annualized) of 1.6%. These improved returns may hint at some real business momentum, implying that now could be a great time to delve deeper. I find it very interesting to look at share price over the long term as a proxy for business performance. But to truly gain insight, we need to consider other information, too. Even so, be aware that Viva Energy Group is showing 2 warning signs in our investment analysis , you should know about...
Of course Viva Energy Group may not be the best stock to buy. So you may wish to see this free collection of growth stocks.
Please note, the market returns quoted in this article reflect the market weighted average returns of stocks that currently trade on AU exchanges.
Have feedback on this article? Concerned about the content? Get in touch with us directly. Alternatively, email editorial-team (at) simplywallst.com.
This article by Simply Wall St is general in nature. We provide commentary based on historical data and analyst forecasts only using an unbiased methodology and our articles are not intended to be financial advice. It does not constitute a recommendation to buy or sell any stock, and does not take account of your objectives, or your financial situation. We aim to bring you long-term focused analysis driven by fundamental data. Note that our analysis may not factor in the latest price-sensitive company announcements or qualitative material. Simply Wall St has no position in any stocks mentioned.
