
 Yahoo Finance
 Investors in Verisk Analytics (NASDAQ:VRSK) have seen decent returns of 81% over the past five years
The main point of investing for the long term is to make money. Furthermore, you'd generally like to see the share price rise faster than the market. Unfortunately for shareholders, while the Verisk Analytics, Inc. (NASDAQ:VRSK) share price is up 75% in the last five years, that's less than the market return. Looking at the last year alone, the stock is up 14%.
Now it's worth having a look at the company's fundamentals too, because that will help us determine if the long term shareholder return has matched the performance of the underlying business.
View our latest analysis for Verisk Analytics
While markets are a powerful pricing mechanism, share prices reflect investor sentiment, not just underlying business performance. By comparing earnings per share (EPS) and share price changes over time, we can get a feel for how investor attitudes to a company have morphed over time.
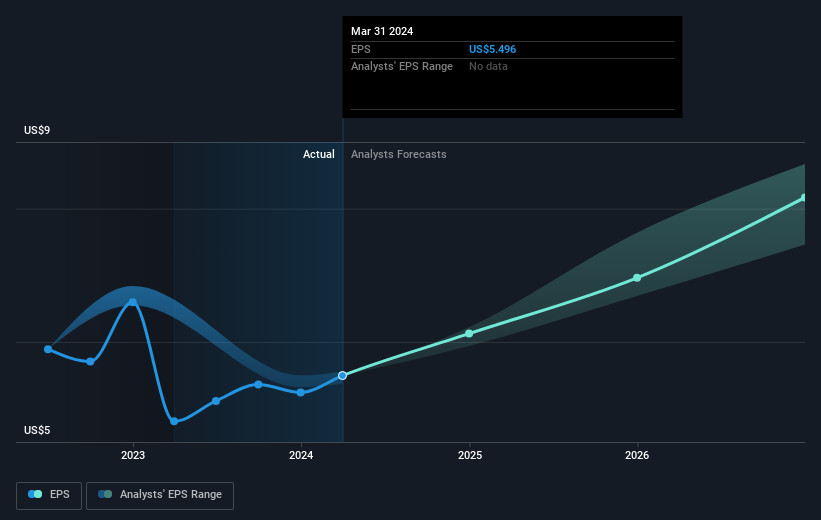
During five years of share price growth, Verisk Analytics achieved compound earnings per share (EPS) growth of 8.8% per year. This EPS growth is lower than the 12% average annual increase in the share price. This suggests that market participants hold the company in higher regard, these days. And that's hardly shocking given the track record of growth.
The company's earnings per share (over time) is depicted in the image below (click to see the exact numbers).
We know that Verisk Analytics has improved its bottom line lately, but is it going to grow revenue? You could check out this free report showing analyst revenue forecasts.
What About Dividends?
It is important to consider the total shareholder return, as well as the share price return, for any given stock. The TSR incorporates the value of any spin-offs or discounted capital raisings, along with any dividends, based on the assumption that the dividends are reinvested. Arguably, the TSR gives a more comprehensive picture of the return generated by a stock. We note that for Verisk Analytics the TSR over the last 5 years was 81%, which is better than the share price return mentioned above. The dividends paid by the company have thusly boosted the total shareholder return.
A Different Perspective
Verisk Analytics shareholders are up 15% for the year (even including dividends). But that return falls short of the market. On the bright side, that's still a gain, and it's actually better than the average return of 13% over half a decade This suggests the company might be improving over time. It's always interesting to track share price performance over the longer term. But to understand Verisk Analytics better, we need to consider many other factors. For instance, we've identified 1 warning sign for Verisk Analytics that you should be aware of.
If you like to buy stocks alongside management, then you might just love this free list of companies. (Hint: many of them are unnoticed AND have attractive valuation).
Please note, the market returns quoted in this article reflect the market weighted average returns of stocks that currently trade on American exchanges.
Have feedback on this article? Concerned about the content? Get in touch with us directly. Alternatively, email editorial-team (at) simplywallst.com.
This article by Simply Wall St is general in nature. We provide commentary based on historical data and analyst forecasts only using an unbiased methodology and our articles are not intended to be financial advice. It does not constitute a recommendation to buy or sell any stock, and does not take account of your objectives, or your financial situation. We aim to bring you long-term focused analysis driven by fundamental data. Note that our analysis may not factor in the latest price-sensitive company announcements or qualitative material. Simply Wall St has no position in any stocks mentioned.
