
 Yahoo Finance
 Investors in Vera Bradley (NASDAQ:VRA) have unfortunately lost 71% over the last three years
As every investor would know, not every swing hits the sweet spot. But really bad investments should be rare. So consider, for a moment, the misfortune of Vera Bradley, Inc. (NASDAQ:VRA) investors who have held the stock for three years as it declined a whopping 71%. That would certainly shake our confidence in the decision to own the stock. The more recent news is of little comfort, with the share price down 70% in a year. The falls have accelerated recently, with the share price down 32% in the last three months.
With that in mind, it's worth seeing if the company's underlying fundamentals have been the driver of long term performance, or if there are some discrepancies.
View our latest analysis for Vera Bradley
There is no denying that markets are sometimes efficient, but prices do not always reflect underlying business performance. One way to examine how market sentiment has changed over time is to look at the interaction between a company's share price and its earnings per share (EPS).
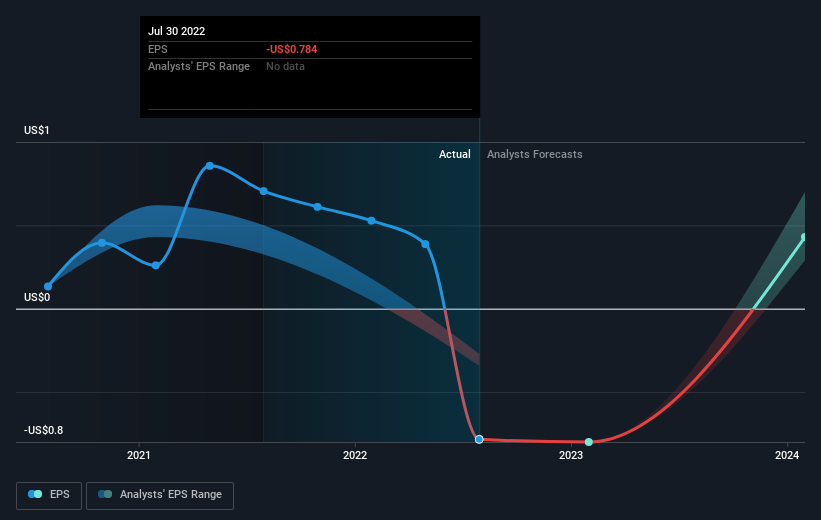
Over the three years that the share price declined, Vera Bradley's earnings per share (EPS) dropped significantly, falling to a loss. This was, in part, due to extraordinary items impacting earnings. Since the company has fallen to a loss making position, it's hard to compare the change in EPS with the share price change. But it's safe to say we'd generally expect the share price to be lower as a result!
You can see how EPS has changed over time in the image below (click on the chart to see the exact values).
It might be well worthwhile taking a look at our free report on Vera Bradley's earnings, revenue and cash flow.
A Different Perspective
While the broader market lost about 23% in the twelve months, Vera Bradley shareholders did even worse, losing 70%. However, it could simply be that the share price has been impacted by broader market jitters. It might be worth keeping an eye on the fundamentals, in case there's a good opportunity. Unfortunately, last year's performance may indicate unresolved challenges, given that it was worse than the annualised loss of 10% over the last half decade. Generally speaking long term share price weakness can be a bad sign, though contrarian investors might want to research the stock in hope of a turnaround. While it is well worth considering the different impacts that market conditions can have on the share price, there are other factors that are even more important. To that end, you should be aware of the 1 warning sign we've spotted with Vera Bradley .
Of course Vera Bradley may not be the best stock to buy. So you may wish to see this free collection of growth stocks.
Please note, the market returns quoted in this article reflect the market weighted average returns of stocks that currently trade on US exchanges.
Have feedback on this article? Concerned about the content? Get in touch with us directly. Alternatively, email editorial-team (at) simplywallst.com.
This article by Simply Wall St is general in nature. We provide commentary based on historical data and analyst forecasts only using an unbiased methodology and our articles are not intended to be financial advice. It does not constitute a recommendation to buy or sell any stock, and does not take account of your objectives, or your financial situation. We aim to bring you long-term focused analysis driven by fundamental data. Note that our analysis may not factor in the latest price-sensitive company announcements or qualitative material. Simply Wall St has no position in any stocks mentioned.
Join A Paid User Research Session
You’ll receive a US$30 Amazon Gift card for 1 hour of your time while helping us build better investing tools for the individual investors like yourself. Sign up here
