
 Yahoo Finance
 Investors in Urban Edge Properties (NYSE:UE) have unfortunately lost 31% over the last five years
The main aim of stock picking is to find the market-beating stocks. But in any portfolio, there will be mixed results between individual stocks. So we wouldn't blame long term Urban Edge Properties (NYSE:UE) shareholders for doubting their decision to hold, with the stock down 45% over a half decade. We also note that the stock has performed poorly over the last year, with the share price down 24%.
With that in mind, it's worth seeing if the company's underlying fundamentals have been the driver of long term performance, or if there are some discrepancies.
View our latest analysis for Urban Edge Properties
While the efficient markets hypothesis continues to be taught by some, it has been proven that markets are over-reactive dynamic systems, and investors are not always rational. One flawed but reasonable way to assess how sentiment around a company has changed is to compare the earnings per share (EPS) with the share price.
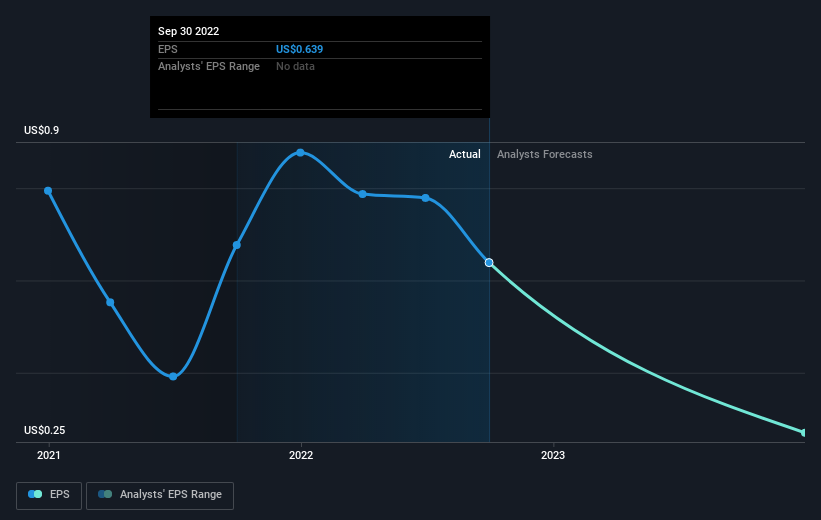
Looking back five years, both Urban Edge Properties' share price and EPS declined; the latter at a rate of 8.0% per year. Readers should note that the share price has fallen faster than the EPS, at a rate of 11% per year, over the period. This implies that the market was previously too optimistic about the stock.
The graphic below depicts how EPS has changed over time (unveil the exact values by clicking on the image).
Dive deeper into Urban Edge Properties' key metrics by checking this interactive graph of Urban Edge Properties's earnings, revenue and cash flow.
What About Dividends?
It is important to consider the total shareholder return, as well as the share price return, for any given stock. The TSR incorporates the value of any spin-offs or discounted capital raisings, along with any dividends, based on the assumption that the dividends are reinvested. So for companies that pay a generous dividend, the TSR is often a lot higher than the share price return. We note that for Urban Edge Properties the TSR over the last 5 years was -31%, which is better than the share price return mentioned above. The dividends paid by the company have thusly boosted the total shareholder return.
A Different Perspective
The total return of 21% received by Urban Edge Properties shareholders over the last year isn't far from the market return of -22%. So last year was actually even worse than the last five years, which cost shareholders 6% per year. Weak performance over the long term usually destroys market confidence in a stock, but bargain hunters may want to take a closer look for signs of a turnaround. I find it very interesting to look at share price over the long term as a proxy for business performance. But to truly gain insight, we need to consider other information, too. Like risks, for instance. Every company has them, and we've spotted 3 warning signs for Urban Edge Properties (of which 2 are a bit unpleasant!) you should know about.
If you like to buy stocks alongside management, then you might just love this free list of companies. (Hint: insiders have been buying them).
Please note, the market returns quoted in this article reflect the market weighted average returns of stocks that currently trade on US exchanges.
Have feedback on this article? Concerned about the content? Get in touch with us directly. Alternatively, email editorial-team (at) simplywallst.com.
This article by Simply Wall St is general in nature. We provide commentary based on historical data and analyst forecasts only using an unbiased methodology and our articles are not intended to be financial advice. It does not constitute a recommendation to buy or sell any stock, and does not take account of your objectives, or your financial situation. We aim to bring you long-term focused analysis driven by fundamental data. Note that our analysis may not factor in the latest price-sensitive company announcements or qualitative material. Simply Wall St has no position in any stocks mentioned.
Join A Paid User Research Session
You’ll receive a US$30 Amazon Gift card for 1 hour of your time while helping us build better investing tools for the individual investors like yourself. Sign up here
