
 Yahoo Finance
 Investors in Tree Island Steel (TSE:TSL) have seen stellar returns of 141% over the past five years
Stock pickers are generally looking for stocks that will outperform the broader market. And in our experience, buying the right stocks can give your wealth a significant boost. For example, the Tree Island Steel Ltd. (TSE:TSL) share price is up 59% in the last 5 years, clearly besting the market return of around 30% (ignoring dividends). On the other hand, the more recent gains haven't been so impressive, with shareholders gaining just 6.7% , including dividends .
So let's investigate and see if the longer term performance of the company has been in line with the underlying business' progress.
View our latest analysis for Tree Island Steel
To quote Buffett, 'Ships will sail around the world but the Flat Earth Society will flourish. There will continue to be wide discrepancies between price and value in the marketplace...' One flawed but reasonable way to assess how sentiment around a company has changed is to compare the earnings per share (EPS) with the share price.
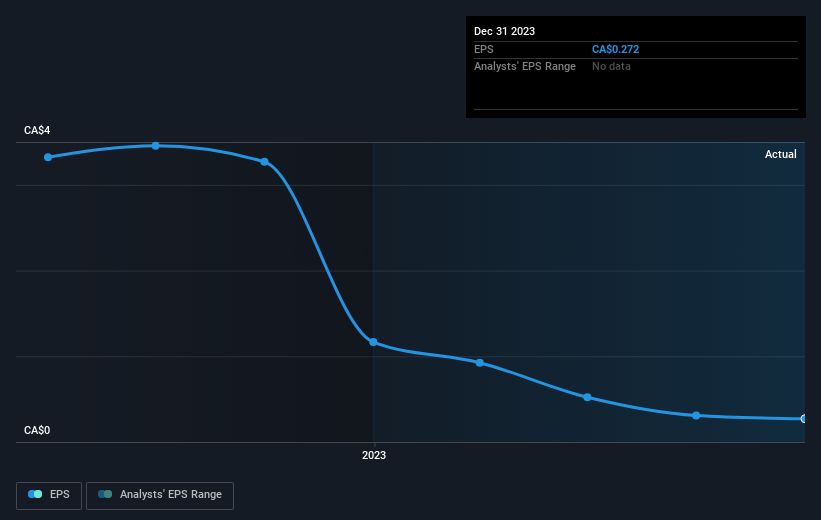
Over half a decade, Tree Island Steel managed to grow its earnings per share at 26% a year. This EPS growth is higher than the 10% average annual increase in the share price. So it seems the market isn't so enthusiastic about the stock these days. The reasonably low P/E ratio of 11.49 also suggests market apprehension.
You can see how EPS has changed over time in the image below (click on the chart to see the exact values).
This free interactive report on Tree Island Steel's earnings, revenue and cash flow is a great place to start, if you want to investigate the stock further.
What About Dividends?
As well as measuring the share price return, investors should also consider the total shareholder return (TSR). The TSR incorporates the value of any spin-offs or discounted capital raisings, along with any dividends, based on the assumption that the dividends are reinvested. So for companies that pay a generous dividend, the TSR is often a lot higher than the share price return. As it happens, Tree Island Steel's TSR for the last 5 years was 141%, which exceeds the share price return mentioned earlier. This is largely a result of its dividend payments!
A Different Perspective
Tree Island Steel provided a TSR of 6.7% over the year (including dividends). That's fairly close to the broader market return. We should note here that the five-year TSR is more impressive, at 19% per year. More recently, the share price growth has slowed. But it has to be said the overall picture is one of good long term and short term performance. Arguably that makes Tree Island Steel a stock worth watching. While it is well worth considering the different impacts that market conditions can have on the share price, there are other factors that are even more important. Case in point: We've spotted 3 warning signs for Tree Island Steel you should be aware of.
If you are like me, then you will not want to miss this free list of growing companies that insiders are buying.
Please note, the market returns quoted in this article reflect the market weighted average returns of stocks that currently trade on Canadian exchanges.
Have feedback on this article? Concerned about the content? Get in touch with us directly. Alternatively, email editorial-team (at) simplywallst.com.
This article by Simply Wall St is general in nature. We provide commentary based on historical data and analyst forecasts only using an unbiased methodology and our articles are not intended to be financial advice. It does not constitute a recommendation to buy or sell any stock, and does not take account of your objectives, or your financial situation. We aim to bring you long-term focused analysis driven by fundamental data. Note that our analysis may not factor in the latest price-sensitive company announcements or qualitative material. Simply Wall St has no position in any stocks mentioned.
