
 Yahoo Finance
 Investors in Stratec (ETR:SBS) have unfortunately lost 42% over the last year
Investors can approximate the average market return by buying an index fund. While individual stocks can be big winners, plenty more fail to generate satisfactory returns. That downside risk was realized by Stratec SE (ETR:SBS) shareholders over the last year, as the share price declined 42%. That's well below the market decline of 3.2%. However, the longer term returns haven't been so bad, with the stock down 29% in the last three years. Shareholders have had an even rougher run lately, with the share price down 27% in the last 90 days. We note that the company has reported results fairly recently; and the market is hardly delighted. You can check out the latest numbers in our company report.
It's worthwhile assessing if the company's economics have been moving in lockstep with these underwhelming shareholder returns, or if there is some disparity between the two. So let's do just that.
See our latest analysis for Stratec
In his essay The Superinvestors of Graham-and-Doddsville Warren Buffett described how share prices do not always rationally reflect the value of a business. One imperfect but simple way to consider how the market perception of a company has shifted is to compare the change in the earnings per share (EPS) with the share price movement.
Unfortunately Stratec reported an EPS drop of 51% for the last year. This fall in the EPS is significantly worse than the 42% the share price fall. So the market may not be too worried about the EPS figure, at the moment -- or it may have expected earnings to drop faster.
The company's earnings per share (over time) is depicted in the image below (click to see the exact numbers).
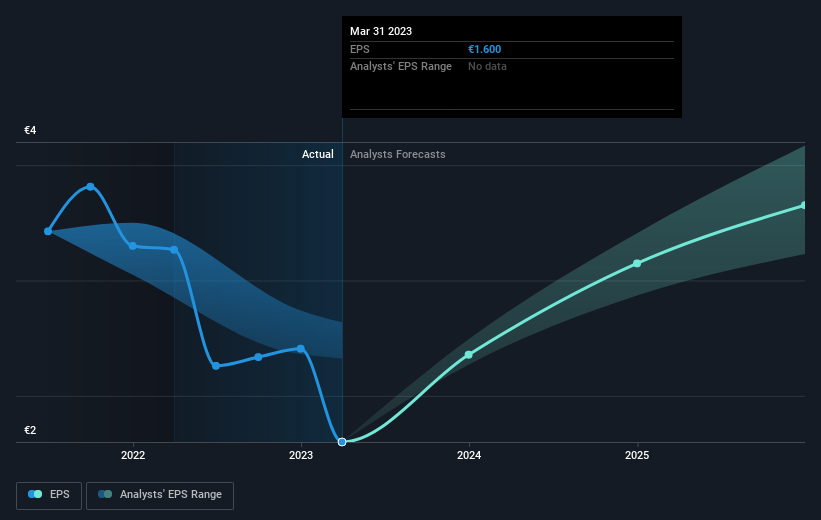
Dive deeper into Stratec's key metrics by checking this interactive graph of Stratec's earnings, revenue and cash flow.
A Different Perspective
We regret to report that Stratec shareholders are down 42% for the year (even including dividends). Unfortunately, that's worse than the broader market decline of 3.2%. However, it could simply be that the share price has been impacted by broader market jitters. It might be worth keeping an eye on the fundamentals, in case there's a good opportunity. Unfortunately, last year's performance may indicate unresolved challenges, given that it was worse than the annualised loss of 1.8% over the last half decade. Generally speaking long term share price weakness can be a bad sign, though contrarian investors might want to research the stock in hope of a turnaround. It's always interesting to track share price performance over the longer term. But to understand Stratec better, we need to consider many other factors. Take risks, for example - Stratec has 2 warning signs we think you should be aware of.
We will like Stratec better if we see some big insider buys. While we wait, check out this free list of growing companies with considerable, recent, insider buying.
Please note, the market returns quoted in this article reflect the market weighted average returns of stocks that currently trade on German exchanges.
Have feedback on this article? Concerned about the content? Get in touch with us directly. Alternatively, email editorial-team (at) simplywallst.com.
This article by Simply Wall St is general in nature. We provide commentary based on historical data and analyst forecasts only using an unbiased methodology and our articles are not intended to be financial advice. It does not constitute a recommendation to buy or sell any stock, and does not take account of your objectives, or your financial situation. We aim to bring you long-term focused analysis driven by fundamental data. Note that our analysis may not factor in the latest price-sensitive company announcements or qualitative material. Simply Wall St has no position in any stocks mentioned.
Join A Paid User Research Session
You’ll receive a US$30 Amazon Gift card for 1 hour of your time while helping us build better investing tools for the individual investors like yourself. Sign up here
