
 Yahoo Finance
 Investors Still Waiting For A Pull Back In Aspen Pharmacare Holdings Limited (JSE:APN)
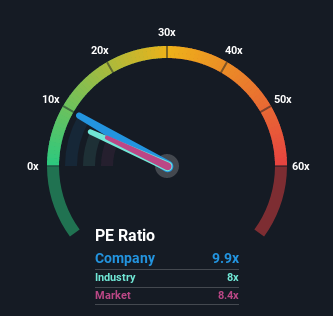
There wouldn't be many who think Aspen Pharmacare Holdings Limited's (JSE:APN) price-to-earnings (or "P/E") ratio of 9.9x is worth a mention when the median P/E in South Africa is similar at about 8x. However, investors might be overlooking a clear opportunity or potential setback if there is no rational basis for the P/E.
With earnings growth that's superior to most other companies of late, Aspen Pharmacare Holdings has been doing relatively well. One possibility is that the P/E is moderate because investors think this strong earnings performance might be about to tail off. If not, then existing shareholders have reason to be feeling optimistic about the future direction of the share price.
View our latest analysis for Aspen Pharmacare Holdings
Want the full picture on analyst estimates for the company? Then our free report on Aspen Pharmacare Holdings will help you uncover what's on the horizon.
What Are Growth Metrics Telling Us About The P/E?
The only time you'd be comfortable seeing a P/E like Aspen Pharmacare Holdings' is when the company's growth is tracking the market closely.
Taking a look back first, we see that the company grew earnings per share by an impressive 36% last year. The latest three year period has also seen an excellent 296% overall rise in EPS, aided by its short-term performance. So we can start by confirming that the company has done a great job of growing earnings over that time.
Shifting to the future, estimates from the six analysts covering the company suggest earnings should grow by 7.4% per year over the next three years. With the market predicted to deliver 7.0% growth each year, the company is positioned for a comparable earnings result.
In light of this, it's understandable that Aspen Pharmacare Holdings' P/E sits in line with the majority of other companies. Apparently shareholders are comfortable to simply hold on while the company is keeping a low profile.
The Key Takeaway
Using the price-to-earnings ratio alone to determine if you should sell your stock isn't sensible, however it can be a practical guide to the company's future prospects.
We've established that Aspen Pharmacare Holdings maintains its moderate P/E off the back of its forecast growth being in line with the wider market, as expected. At this stage investors feel the potential for an improvement or deterioration in earnings isn't great enough to justify a high or low P/E ratio. Unless these conditions change, they will continue to support the share price at these levels.
The company's balance sheet is another key area for risk analysis. You can assess many of the main risks through our free balance sheet analysis for Aspen Pharmacare Holdings with six simple checks.
Of course, you might also be able to find a better stock than Aspen Pharmacare Holdings. So you may wish to see this free collection of other companies that sit on P/E's below 20x and have grown earnings strongly.
Have feedback on this article? Concerned about the content? Get in touch with us directly. Alternatively, email editorial-team (at) simplywallst.com.
This article by Simply Wall St is general in nature. We provide commentary based on historical data and analyst forecasts only using an unbiased methodology and our articles are not intended to be financial advice. It does not constitute a recommendation to buy or sell any stock, and does not take account of your objectives, or your financial situation. We aim to bring you long-term focused analysis driven by fundamental data. Note that our analysis may not factor in the latest price-sensitive company announcements or qualitative material. Simply Wall St has no position in any stocks mentioned.
Join A Paid User Research Session
You’ll receive a US$30 Amazon Gift card for 1 hour of your time while helping us build better investing tools for the individual investors like yourself. Sign up here
