
 Yahoo Finance
 Investors Shouldn't Overlook The Favourable Returns On Capital At Amphenol (NYSE:APH)
If you're not sure where to start when looking for the next multi-bagger, there are a few key trends you should keep an eye out for. Firstly, we'll want to see a proven return on capital employed (ROCE) that is increasing, and secondly, an expanding base of capital employed. If you see this, it typically means it's a company with a great business model and plenty of profitable reinvestment opportunities. With that in mind, the ROCE of Amphenol (NYSE:APH) looks attractive right now, so lets see what the trend of returns can tell us.
Return On Capital Employed (ROCE): What Is It?
For those who don't know, ROCE is a measure of a company's yearly pre-tax profit (its return), relative to the capital employed in the business. To calculate this metric for Amphenol, this is the formula:
Return on Capital Employed = Earnings Before Interest and Tax (EBIT) ÷ (Total Assets - Current Liabilities)
0.20 = US$2.7b ÷ (US$17b - US$3.4b) (Based on the trailing twelve months to March 2024).
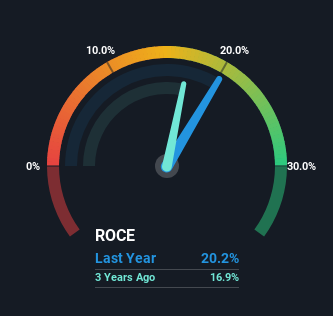
Thus, Amphenol has an ROCE of 20%. In absolute terms that's a great return and it's even better than the Electronic industry average of 11%.
Check out our latest analysis for Amphenol
In the above chart we have measured Amphenol's prior ROCE against its prior performance, but the future is arguably more important. If you'd like to see what analysts are forecasting going forward, you should check out our free analyst report for Amphenol .
How Are Returns Trending?
It's hard not to be impressed by Amphenol's returns on capital. The company has employed 55% more capital in the last five years, and the returns on that capital have remained stable at 20%. Now considering ROCE is an attractive 20%, this combination is actually pretty appealing because it means the business can consistently put money to work and generate these high returns. You'll see this when looking at well operated businesses or favorable business models.
The Bottom Line On Amphenol's ROCE
In summary, we're delighted to see that Amphenol has been compounding returns by reinvesting at consistently high rates of return, as these are common traits of a multi-bagger. And long term investors would be thrilled with the 191% return they've received over the last five years. So while the positive underlying trends may be accounted for by investors, we still think this stock is worth looking into further.
Before jumping to any conclusions though, we need to know what value we're getting for the current share price. That's where you can check out our FREE intrinsic value estimation for APH that compares the share price and estimated value.
If you'd like to see other companies earning high returns, check out our free list of companies earning high returns with solid balance sheets here.
Have feedback on this article? Concerned about the content? Get in touch with us directly. Alternatively, email editorial-team (at) simplywallst.com.
This article by Simply Wall St is general in nature. We provide commentary based on historical data and analyst forecasts only using an unbiased methodology and our articles are not intended to be financial advice. It does not constitute a recommendation to buy or sell any stock, and does not take account of your objectives, or your financial situation. We aim to bring you long-term focused analysis driven by fundamental data. Note that our analysis may not factor in the latest price-sensitive company announcements or qualitative material. Simply Wall St has no position in any stocks mentioned.
Have feedback on this article? Concerned about the content? Get in touch with us directly. Alternatively, email editorial-team@simplywallst.com
