
 Yahoo Finance
 Investors Shouldn't Overlook The Favourable Returns On Capital At Intertek Group (LON:ITRK)
There are a few key trends to look for if we want to identify the next multi-bagger. One common approach is to try and find a company with returns on capital employed (ROCE) that are increasing, in conjunction with a growing amount of capital employed. Put simply, these types of businesses are compounding machines, meaning they are continually reinvesting their earnings at ever-higher rates of return. That's why when we briefly looked at Intertek Group's (LON:ITRK) ROCE trend, we were very happy with what we saw.
Return On Capital Employed (ROCE): What Is It?
For those who don't know, ROCE is a measure of a company's yearly pre-tax profit (its return), relative to the capital employed in the business. To calculate this metric for Intertek Group, this is the formula:
Return on Capital Employed = Earnings Before Interest and Tax (EBIT) ÷ (Total Assets - Current Liabilities)
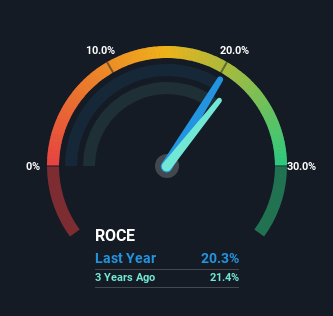
0.20 = UK£518m ÷ (UK£3.5b - UK£982m) (Based on the trailing twelve months to December 2023).
Thus, Intertek Group has an ROCE of 20%. On its own, that's a very good return and it's on par with the returns earned by companies in a similar industry.
See our latest analysis for Intertek Group
In the above chart we have measured Intertek Group's prior ROCE against its prior performance, but the future is arguably more important. If you'd like, you can check out the forecasts from the analysts covering Intertek Group for free.
So How Is Intertek Group's ROCE Trending?
We'd be pretty happy with returns on capital like Intertek Group. The company has employed 35% more capital in the last five years, and the returns on that capital have remained stable at 20%. Now considering ROCE is an attractive 20%, this combination is actually pretty appealing because it means the business can consistently put money to work and generate these high returns. If Intertek Group can keep this up, we'd be very optimistic about its future.
What We Can Learn From Intertek Group's ROCE
In short, we'd argue Intertek Group has the makings of a multi-bagger since its been able to compound its capital at very profitable rates of return. In light of this, the stock has only gained 10% over the last five years for shareholders who have owned the stock in this period. That's why it could be worth your time looking into this stock further to discover if it has more traits of a multi-bagger.
Intertek Group does have some risks though, and we've spotted 1 warning sign for Intertek Group that you might be interested in.
If you want to search for more stocks that have been earning high returns, check out this free list of stocks with solid balance sheets that are also earning high returns on equity.
Have feedback on this article? Concerned about the content? Get in touch with us directly. Alternatively, email editorial-team (at) simplywallst.com.
This article by Simply Wall St is general in nature. We provide commentary based on historical data and analyst forecasts only using an unbiased methodology and our articles are not intended to be financial advice. It does not constitute a recommendation to buy or sell any stock, and does not take account of your objectives, or your financial situation. We aim to bring you long-term focused analysis driven by fundamental data. Note that our analysis may not factor in the latest price-sensitive company announcements or qualitative material. Simply Wall St has no position in any stocks mentioned.
