
 Yahoo Finance
 Investors in SCYNEXIS (NASDAQ:SCYX) have unfortunately lost 87% over the last five years
Long term investing is the way to go, but that doesn't mean you should hold every stock forever. We don't wish catastrophic capital loss on anyone. For example, we sympathize with anyone who was caught holding SCYNEXIS, Inc. (NASDAQ:SCYX) during the five years that saw its share price drop a whopping 87%. And some of the more recent buyers are probably worried, too, with the stock falling 37% in the last year. But it's up 9.2% in the last week. We really hope anyone holding through that price crash has a diversified portfolio. Even when you lose money, you don't have to lose the lesson.
Now let's have a look at the company's fundamentals, and see if the long term shareholder return has matched the performance of the underlying business.
See our latest analysis for SCYNEXIS
There is no denying that markets are sometimes efficient, but prices do not always reflect underlying business performance. One way to examine how market sentiment has changed over time is to look at the interaction between a company's share price and its earnings per share (EPS).
During five years of share price growth, SCYNEXIS moved from a loss to profitability. That would generally be considered a positive, so we are surprised to see the share price is down. Other metrics may better explain the share price move.
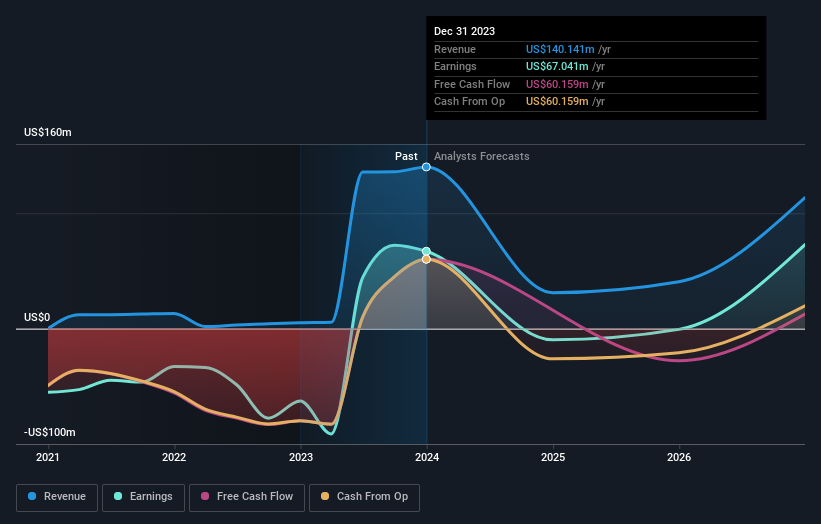
In contrast to the share price, revenue has actually increased by 87% a year in the five year period. So it seems one might have to take closer look at the fundamentals to understand why the share price languishes. After all, there may be an opportunity.
The company's revenue and earnings (over time) are depicted in the image below (click to see the exact numbers).
It is of course excellent to see how SCYNEXIS has grown profits over the years, but the future is more important for shareholders. This free interactive report on SCYNEXIS' balance sheet strength is a great place to start, if you want to investigate the stock further.
A Different Perspective
Investors in SCYNEXIS had a tough year, with a total loss of 37%, against a market gain of about 28%. Even the share prices of good stocks drop sometimes, but we want to see improvements in the fundamental metrics of a business, before getting too interested. Unfortunately, last year's performance may indicate unresolved challenges, given that it was worse than the annualised loss of 13% over the last half decade. Generally speaking long term share price weakness can be a bad sign, though contrarian investors might want to research the stock in hope of a turnaround. While it is well worth considering the different impacts that market conditions can have on the share price, there are other factors that are even more important. Consider risks, for instance. Every company has them, and we've spotted 3 warning signs for SCYNEXIS you should know about.
If you would prefer to check out another company -- one with potentially superior financials -- then do not miss this free list of companies that have proven they can grow earnings.
Please note, the market returns quoted in this article reflect the market weighted average returns of stocks that currently trade on American exchanges.
Have feedback on this article? Concerned about the content? Get in touch with us directly. Alternatively, email editorial-team (at) simplywallst.com.
This article by Simply Wall St is general in nature. We provide commentary based on historical data and analyst forecasts only using an unbiased methodology and our articles are not intended to be financial advice. It does not constitute a recommendation to buy or sell any stock, and does not take account of your objectives, or your financial situation. We aim to bring you long-term focused analysis driven by fundamental data. Note that our analysis may not factor in the latest price-sensitive company announcements or qualitative material. Simply Wall St has no position in any stocks mentioned.
