
 Yahoo Finance
 Investors in Base Resources (ASX:BSE) have seen respectable returns of 95% over the past year
These days it's easy to simply buy an index fund, and your returns should (roughly) match the market. But investors can boost returns by picking market-beating companies to own shares in. For example, the Base Resources Limited (ASX:BSE) share price is up 61% in the last 1 year, clearly besting the market return of around 9.6% (not including dividends). If it can keep that out-performance up over the long term, investors will do very well! In contrast, the longer term returns are negative, since the share price is 7.0% lower than it was three years ago.
With that in mind, it's worth seeing if the company's underlying fundamentals have been the driver of long term performance, or if there are some discrepancies.
Check out our latest analysis for Base Resources
To quote Buffett, 'Ships will sail around the world but the Flat Earth Society will flourish. There will continue to be wide discrepancies between price and value in the marketplace...' By comparing earnings per share (EPS) and share price changes over time, we can get a feel for how investor attitudes to a company have morphed over time.
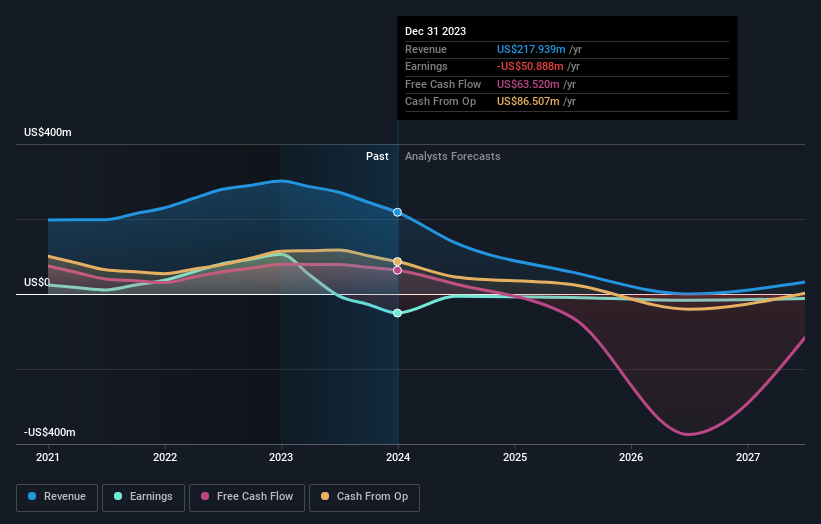
Over the last twelve months Base Resources went from profitable to unprofitable. While some may see this as temporary, we're a skeptical bunch, and so we're a little surprised to see the share price go up. We might get a clue to explain the share price move by looking to other metrics.
Base Resources' revenue actually dropped 28% over last year. So the fundamental metrics don't provide an obvious explanation for the share price gain.
The image below shows how earnings and revenue have tracked over time (if you click on the image you can see greater detail).
Balance sheet strength is crucial. It might be well worthwhile taking a look at our free report on how its financial position has changed over time.
What About The Total Shareholder Return (TSR)?
Investors should note that there's a difference between Base Resources' total shareholder return (TSR) and its share price change, which we've covered above. The TSR is a return calculation that accounts for the value of cash dividends (assuming that any dividend received was reinvested) and the calculated value of any discounted capital raisings and spin-offs. Its history of dividend payouts mean that Base Resources' TSR of 95% over the last 1 year is better than the share price return.
A Different Perspective
It's good to see that Base Resources has rewarded shareholders with a total shareholder return of 95% in the last twelve months. Since the one-year TSR is better than the five-year TSR (the latter coming in at 20% per year), it would seem that the stock's performance has improved in recent times. In the best case scenario, this may hint at some real business momentum, implying that now could be a great time to delve deeper. It's always interesting to track share price performance over the longer term. But to understand Base Resources better, we need to consider many other factors. Consider risks, for instance. Every company has them, and we've spotted 1 warning sign for Base Resources you should know about.
If you are like me, then you will not want to miss this free list of undervalued small caps that insiders are buying.
Please note, the market returns quoted in this article reflect the market weighted average returns of stocks that currently trade on Australian exchanges.
Have feedback on this article? Concerned about the content? Get in touch with us directly. Alternatively, email editorial-team (at) simplywallst.com.
This article by Simply Wall St is general in nature. We provide commentary based on historical data and analyst forecasts only using an unbiased methodology and our articles are not intended to be financial advice. It does not constitute a recommendation to buy or sell any stock, and does not take account of your objectives, or your financial situation. We aim to bring you long-term focused analysis driven by fundamental data. Note that our analysis may not factor in the latest price-sensitive company announcements or qualitative material. Simply Wall St has no position in any stocks mentioned.
Have feedback on this article? Concerned about the content? Get in touch with us directly. Alternatively, email editorial-team@simplywallst.com
