
 Yahoo Finance
 Investors in Regions Financial (NYSE:RF) have seen decent returns of 66% over the past five years
The main point of investing for the long term is to make money. Better yet, you'd like to see the share price move up more than the market average. Unfortunately for shareholders, while the Regions Financial Corporation (NYSE:RF) share price is up 37% in the last five years, that's less than the market return. Looking at the last year alone, the stock is up 5.2%.
Let's take a look at the underlying fundamentals over the longer term, and see if they've been consistent with shareholders returns.
See our latest analysis for Regions Financial
To quote Buffett, 'Ships will sail around the world but the Flat Earth Society will flourish. There will continue to be wide discrepancies between price and value in the marketplace...' One imperfect but simple way to consider how the market perception of a company has shifted is to compare the change in the earnings per share (EPS) with the share price movement.
During five years of share price growth, Regions Financial achieved compound earnings per share (EPS) growth of 6.3% per year. This EPS growth is remarkably close to the 6% average annual increase in the share price. That suggests that the market sentiment around the company hasn't changed much over that time. Rather, the share price has approximately tracked EPS growth.
You can see below how EPS has changed over time (discover the exact values by clicking on the image).
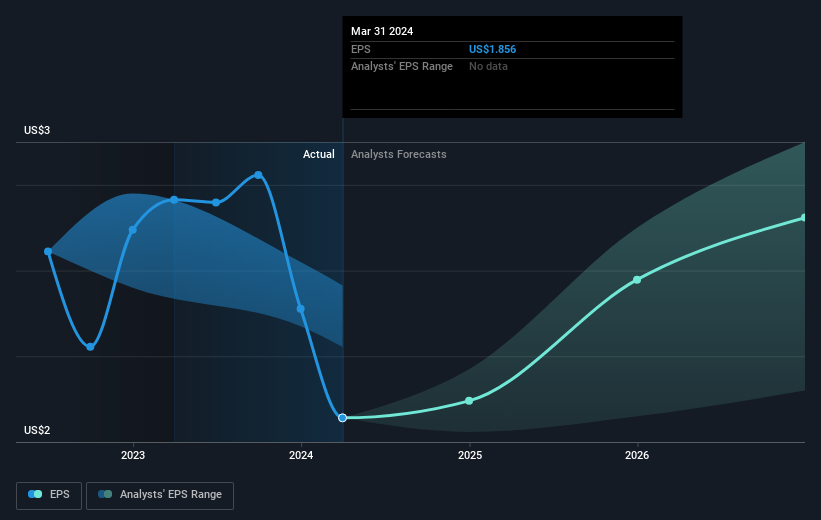
It's probably worth noting we've seen significant insider buying in the last quarter, which we consider a positive. On the other hand, we think the revenue and earnings trends are much more meaningful measures of the business. Dive deeper into the earnings by checking this interactive graph of Regions Financial's earnings, revenue and cash flow.
What About Dividends?
As well as measuring the share price return, investors should also consider the total shareholder return (TSR). Whereas the share price return only reflects the change in the share price, the TSR includes the value of dividends (assuming they were reinvested) and the benefit of any discounted capital raising or spin-off. It's fair to say that the TSR gives a more complete picture for stocks that pay a dividend. As it happens, Regions Financial's TSR for the last 5 years was 66%, which exceeds the share price return mentioned earlier. And there's no prize for guessing that the dividend payments largely explain the divergence!
A Different Perspective
Regions Financial provided a TSR of 9.5% over the last twelve months. But that return falls short of the market. On the bright side, the longer term returns (running at about 11% a year, over half a decade) look better. Maybe the share price is just taking a breather while the business executes on its growth strategy. If you want to research this stock further, the data on insider buying is an obvious place to start. You can click here to see who has been buying shares - and the price they paid.
If you like to buy stocks alongside management, then you might just love this free list of companies. (Hint: most of them are flying under the radar).
Please note, the market returns quoted in this article reflect the market weighted average returns of stocks that currently trade on American exchanges.
Have feedback on this article? Concerned about the content? Get in touch with us directly. Alternatively, email editorial-team (at) simplywallst.com.
This article by Simply Wall St is general in nature. We provide commentary based on historical data and analyst forecasts only using an unbiased methodology and our articles are not intended to be financial advice. It does not constitute a recommendation to buy or sell any stock, and does not take account of your objectives, or your financial situation. We aim to bring you long-term focused analysis driven by fundamental data. Note that our analysis may not factor in the latest price-sensitive company announcements or qualitative material. Simply Wall St has no position in any stocks mentioned.
