
 Yahoo Finance
 Investors one-year losses continue as Tennant (NYSE:TNC) dips a further 5.1% this week, earnings continue to decline
Passive investing in an index fund is a good way to ensure your own returns roughly match the overall market. While individual stocks can be big winners, plenty more fail to generate satisfactory returns. That downside risk was realized by Tennant Company (NYSE:TNC) shareholders over the last year, as the share price declined 26%. That's disappointing when you consider the market declined 9.4%. At least the damage isn't so bad if you look at the last three years, since the stock is down 6.0% in that time. Furthermore, it's down 19% in about a quarter. That's not much fun for holders. Of course, this share price action may well have been influenced by the 16% decline in the broader market, throughout the period.
After losing 5.1% this past week, it's worth investigating the company's fundamentals to see what we can infer from past performance.
See our latest analysis for Tennant
While markets are a powerful pricing mechanism, share prices reflect investor sentiment, not just underlying business performance. One flawed but reasonable way to assess how sentiment around a company has changed is to compare the earnings per share (EPS) with the share price.
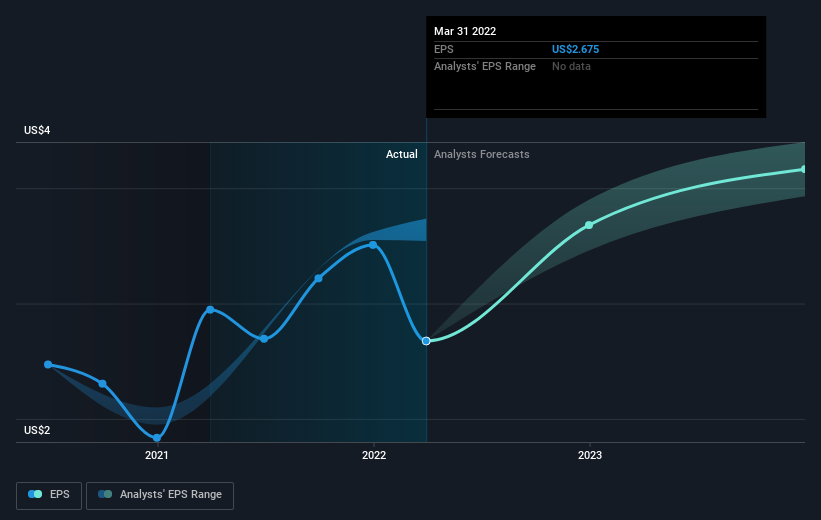
Unfortunately Tennant reported an EPS drop of 9.2% for the last year. The share price decline of 26% is actually more than the EPS drop. So it seems the market was too confident about the business, a year ago.
The graphic below depicts how EPS has changed over time (unveil the exact values by clicking on the image).
Before buying or selling a stock, we always recommend a close examination of historic growth trends, available here.
A Different Perspective
While the broader market lost about 9.4% in the twelve months, Tennant shareholders did even worse, losing 25% (even including dividends). However, it could simply be that the share price has been impacted by broader market jitters. It might be worth keeping an eye on the fundamentals, in case there's a good opportunity. Unfortunately, last year's performance may indicate unresolved challenges, given that it was worse than the annualised loss of 2% over the last half decade. We realise that Baron Rothschild has said investors should "buy when there is blood on the streets", but we caution that investors should first be sure they are buying a high quality business. I find it very interesting to look at share price over the long term as a proxy for business performance. But to truly gain insight, we need to consider other information, too. For example, we've discovered 2 warning signs for Tennant that you should be aware of before investing here.
Of course Tennant may not be the best stock to buy. So you may wish to see this free collection of growth stocks.
Please note, the market returns quoted in this article reflect the market weighted average returns of stocks that currently trade on US exchanges.
Have feedback on this article? Concerned about the content? Get in touch with us directly. Alternatively, email editorial-team (at) simplywallst.com.
This article by Simply Wall St is general in nature. We provide commentary based on historical data and analyst forecasts only using an unbiased methodology and our articles are not intended to be financial advice. It does not constitute a recommendation to buy or sell any stock, and does not take account of your objectives, or your financial situation. We aim to bring you long-term focused analysis driven by fundamental data. Note that our analysis may not factor in the latest price-sensitive company announcements or qualitative material. Simply Wall St has no position in any stocks mentioned.