
 Yahoo Finance
 Investors in Omnicell (NASDAQ:OMCL) have unfortunately lost 80% over the last three years
Every investor on earth makes bad calls sometimes. But really big losses can really drag down an overall portfolio. So consider, for a moment, the misfortune of Omnicell, Inc. (NASDAQ:OMCL) investors who have held the stock for three years as it declined a whopping 80%. That might cause some serious doubts about the merits of the initial decision to buy the stock, to put it mildly. And the ride hasn't got any smoother in recent times over the last year, with the price 54% lower in that time. Shareholders have had an even rougher run lately, with the share price down 20% in the last 90 days. While a drop like that is definitely a body blow, money isn't as important as health and happiness.
So let's have a look and see if the longer term performance of the company has been in line with the underlying business' progress.
See our latest analysis for Omnicell
While markets are a powerful pricing mechanism, share prices reflect investor sentiment, not just underlying business performance. One flawed but reasonable way to assess how sentiment around a company has changed is to compare the earnings per share (EPS) with the share price.
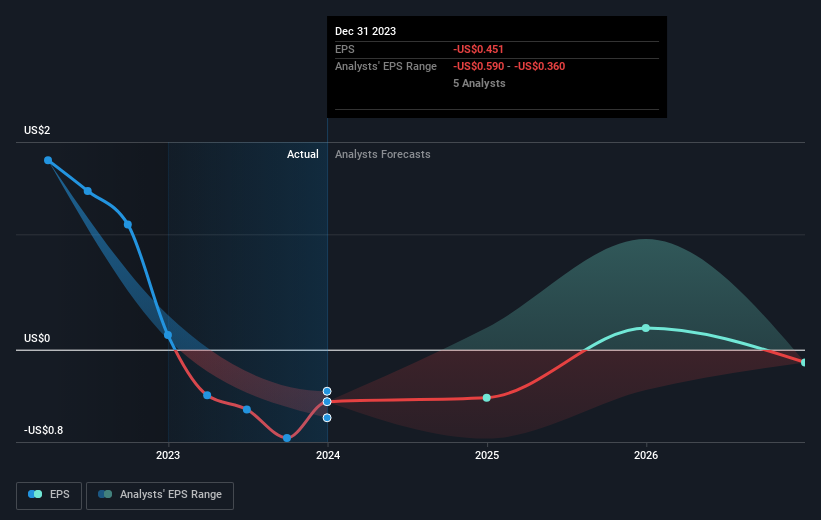
Omnicell saw its share price decline over the three years in which its EPS also dropped, falling to a loss. Since the company has fallen to a loss making position, it's hard to compare the change in EPS with the share price change. But it's safe to say we'd generally expect the share price to be lower as a result!
You can see below how EPS has changed over time (discover the exact values by clicking on the image).
We consider it positive that insiders have made significant purchases in the last year. Having said that, most people consider earnings and revenue growth trends to be a more meaningful guide to the business. Dive deeper into the earnings by checking this interactive graph of Omnicell's earnings, revenue and cash flow.
A Different Perspective
Omnicell shareholders are down 54% for the year, but the market itself is up 25%. Even the share prices of good stocks drop sometimes, but we want to see improvements in the fundamental metrics of a business, before getting too interested. Unfortunately, last year's performance may indicate unresolved challenges, given that it was worse than the annualised loss of 10% over the last half decade. Generally speaking long term share price weakness can be a bad sign, though contrarian investors might want to research the stock in hope of a turnaround. It is all well and good that insiders have been buying shares, but we suggest you check here to see what price insiders were buying at.
If you like to buy stocks alongside management, then you might just love this free list of companies. (Hint: insiders have been buying them).
Please note, the market returns quoted in this article reflect the market weighted average returns of stocks that currently trade on American exchanges.
Have feedback on this article? Concerned about the content? Get in touch with us directly. Alternatively, email editorial-team (at) simplywallst.com.
This article by Simply Wall St is general in nature. We provide commentary based on historical data and analyst forecasts only using an unbiased methodology and our articles are not intended to be financial advice. It does not constitute a recommendation to buy or sell any stock, and does not take account of your objectives, or your financial situation. We aim to bring you long-term focused analysis driven by fundamental data. Note that our analysis may not factor in the latest price-sensitive company announcements or qualitative material. Simply Wall St has no position in any stocks mentioned.
