
 Yahoo Finance
 Investors in Mineralbrunnen Überkingen-Teinach GmbH KGaA (FRA:MUT) have seen returns of 1.0% over the past five years
Ideally, your overall portfolio should beat the market average. But even the best stock picker will only win with some selections. So we wouldn't blame long term Mineralbrunnen Überkingen-Teinach GmbH & Co. KGaA (FRA:MUT) shareholders for doubting their decision to hold, with the stock down 12% over a half decade. Even worse, it's down 8.5% in about a month, which isn't fun at all.
With that in mind, it's worth seeing if the company's underlying fundamentals have been the driver of long term performance, or if there are some discrepancies.
See our latest analysis for Mineralbrunnen Überkingen-Teinach GmbH KGaA
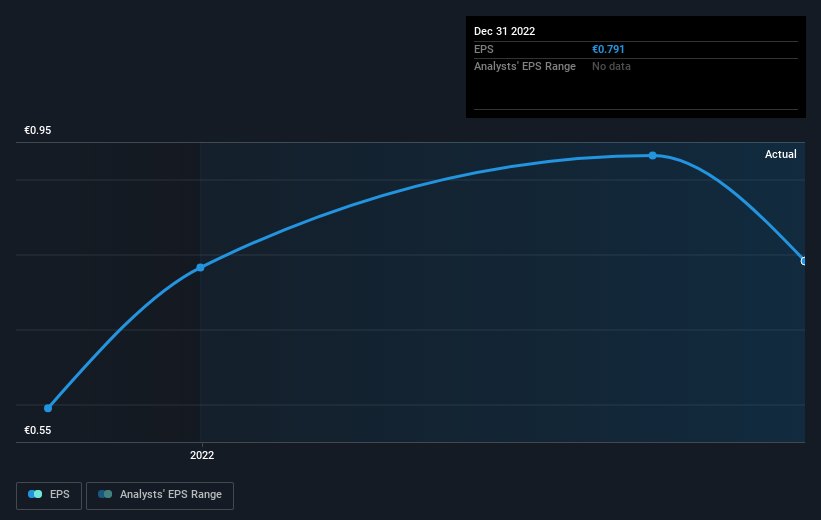
To quote Buffett, 'Ships will sail around the world but the Flat Earth Society will flourish. There will continue to be wide discrepancies between price and value in the marketplace...' By comparing earnings per share (EPS) and share price changes over time, we can get a feel for how investor attitudes to a company have morphed over time.
Looking back five years, both Mineralbrunnen Überkingen-Teinach GmbH KGaA's share price and EPS declined; the latter at a rate of 6.8% per year. The share price decline of 2% per year isn't as bad as the EPS decline. So the market may previously have expected a drop, or else it expects the situation will improve.
The graphic below depicts how EPS has changed over time (unveil the exact values by clicking on the image).
Before buying or selling a stock, we always recommend a close examination of historic growth trends, available here.
What About Dividends?
As well as measuring the share price return, investors should also consider the total shareholder return (TSR). The TSR incorporates the value of any spin-offs or discounted capital raisings, along with any dividends, based on the assumption that the dividends are reinvested. It's fair to say that the TSR gives a more complete picture for stocks that pay a dividend. In the case of Mineralbrunnen Überkingen-Teinach GmbH KGaA, it has a TSR of 1.0% for the last 5 years. That exceeds its share price return that we previously mentioned. And there's no prize for guessing that the dividend payments largely explain the divergence!
A Different Perspective
Mineralbrunnen Überkingen-Teinach GmbH KGaA shareholders are up 2.4% for the year (even including dividends). But that return falls short of the market. On the bright side, that's still a gain, and it's actually better than the average return of 0.2% over half a decade It is possible that returns will improve along with the business fundamentals. It's always interesting to track share price performance over the longer term. But to understand Mineralbrunnen Überkingen-Teinach GmbH KGaA better, we need to consider many other factors. Take risks, for example - Mineralbrunnen Überkingen-Teinach GmbH KGaA has 3 warning signs (and 1 which is potentially serious) we think you should know about.
If you are like me, then you will not want to miss this free list of growing companies that insiders are buying.
Please note, the market returns quoted in this article reflect the market weighted average returns of stocks that currently trade on German exchanges.
Have feedback on this article? Concerned about the content? Get in touch with us directly. Alternatively, email editorial-team (at) simplywallst.com.
This article by Simply Wall St is general in nature. We provide commentary based on historical data and analyst forecasts only using an unbiased methodology and our articles are not intended to be financial advice. It does not constitute a recommendation to buy or sell any stock, and does not take account of your objectives, or your financial situation. We aim to bring you long-term focused analysis driven by fundamental data. Note that our analysis may not factor in the latest price-sensitive company announcements or qualitative material. Simply Wall St has no position in any stocks mentioned.
