
 Yahoo Finance
 Investors Met With Slowing Returns on Capital At Surgery Partners (NASDAQ:SGRY)
Did you know there are some financial metrics that can provide clues of a potential multi-bagger? Typically, we'll want to notice a trend of growing return on capital employed (ROCE) and alongside that, an expanding base of capital employed. If you see this, it typically means it's a company with a great business model and plenty of profitable reinvestment opportunities. Having said that, from a first glance at Surgery Partners (NASDAQ:SGRY) we aren't jumping out of our chairs at how returns are trending, but let's have a deeper look.
Understanding Return On Capital Employed (ROCE)
For those who don't know, ROCE is a measure of a company's yearly pre-tax profit (its return), relative to the capital employed in the business. The formula for this calculation on Surgery Partners is:
Return on Capital Employed = Earnings Before Interest and Tax (EBIT) ÷ (Total Assets - Current Liabilities)
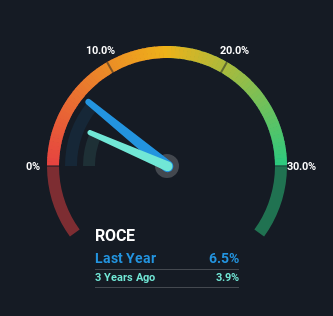
0.065 = US$415m ÷ (US$6.9b - US$523m) (Based on the trailing twelve months to December 2023).
Therefore, Surgery Partners has an ROCE of 6.5%. Ultimately, that's a low return and it under-performs the Healthcare industry average of 11%.
View our latest analysis for Surgery Partners
In the above chart we have measured Surgery Partners' prior ROCE against its prior performance, but the future is arguably more important. If you'd like, you can check out the forecasts from the analysts covering Surgery Partners for free.
What Does the ROCE Trend For Surgery Partners Tell Us?
In terms of Surgery Partners' historical ROCE trend, it doesn't exactly demand attention. The company has employed 47% more capital in the last five years, and the returns on that capital have remained stable at 6.5%. Given the company has increased the amount of capital employed, it appears the investments that have been made simply don't provide a high return on capital.
Our Take On Surgery Partners' ROCE
In conclusion, Surgery Partners has been investing more capital into the business, but returns on that capital haven't increased. Investors must think there's better things to come because the stock has knocked it out of the park, delivering a 141% gain to shareholders who have held over the last five years. But if the trajectory of these underlying trends continue, we think the likelihood of it being a multi-bagger from here isn't high.
If you'd like to know about the risks facing Surgery Partners, we've discovered 1 warning sign that you should be aware of.
For those who like to invest in solid companies, check out this free list of companies with solid balance sheets and high returns on equity.
Have feedback on this article? Concerned about the content? Get in touch with us directly. Alternatively, email editorial-team (at) simplywallst.com.
This article by Simply Wall St is general in nature. We provide commentary based on historical data and analyst forecasts only using an unbiased methodology and our articles are not intended to be financial advice. It does not constitute a recommendation to buy or sell any stock, and does not take account of your objectives, or your financial situation. We aim to bring you long-term focused analysis driven by fundamental data. Note that our analysis may not factor in the latest price-sensitive company announcements or qualitative material. Simply Wall St has no position in any stocks mentioned.
