
 Yahoo Finance
 Investors Met With Slowing Returns on Capital At EMS-CHEMIE HOLDING (VTX:EMSN)
To find a multi-bagger stock, what are the underlying trends we should look for in a business? One common approach is to try and find a company with returns on capital employed (ROCE) that are increasing, in conjunction with a growing amount of capital employed. Put simply, these types of businesses are compounding machines, meaning they are continually reinvesting their earnings at ever-higher rates of return. Having said that, while the ROCE is currently high for EMS-CHEMIE HOLDING (VTX:EMSN), we aren't jumping out of our chairs because returns are decreasing.
Understanding Return On Capital Employed (ROCE)
For those who don't know, ROCE is a measure of a company's yearly pre-tax profit (its return), relative to the capital employed in the business. To calculate this metric for EMS-CHEMIE HOLDING, this is the formula:
Return on Capital Employed = Earnings Before Interest and Tax (EBIT) ÷ (Total Assets - Current Liabilities)
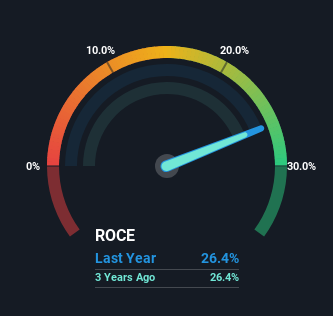
0.26 = CHF567m ÷ (CHF2.5b - CHF308m) (Based on the trailing twelve months to June 2023).
Thus, EMS-CHEMIE HOLDING has an ROCE of 26%. That's a fantastic return and not only that, it outpaces the average of 12% earned by companies in a similar industry.
View our latest analysis for EMS-CHEMIE HOLDING
In the above chart we have measured EMS-CHEMIE HOLDING's prior ROCE against its prior performance, but the future is arguably more important. If you'd like, you can check out the forecasts from the analysts covering EMS-CHEMIE HOLDING here for free.
What The Trend Of ROCE Can Tell Us
Over the past five years, EMS-CHEMIE HOLDING's ROCE and capital employed have both remained mostly flat. This tells us the company isn't reinvesting in itself, so it's plausible that it's past the growth phase. Although current returns are high, we'd need more evidence of underlying growth for it to look like a multi-bagger going forward. That probably explains why EMS-CHEMIE HOLDING has been paying out 95% of its earnings as dividends to shareholders. Most shareholders probably know this and own the stock for its dividend.
What We Can Learn From EMS-CHEMIE HOLDING's ROCE
In summary, EMS-CHEMIE HOLDING isn't compounding its earnings but is generating decent returns on the same amount of capital employed. And with the stock having returned a mere 30% in the last five years to shareholders, you could argue that they're aware of these lackluster trends. So if you're looking for a multi-bagger, the underlying trends indicate you may have better chances elsewhere.
Like most companies, EMS-CHEMIE HOLDING does come with some risks, and we've found 1 warning sign that you should be aware of.
If you want to search for more stocks that have been earning high returns, check out this free list of stocks with solid balance sheets that are also earning high returns on equity.
Have feedback on this article? Concerned about the content? Get in touch with us directly. Alternatively, email editorial-team (at) simplywallst.com.
This article by Simply Wall St is general in nature. We provide commentary based on historical data and analyst forecasts only using an unbiased methodology and our articles are not intended to be financial advice. It does not constitute a recommendation to buy or sell any stock, and does not take account of your objectives, or your financial situation. We aim to bring you long-term focused analysis driven by fundamental data. Note that our analysis may not factor in the latest price-sensitive company announcements or qualitative material. Simply Wall St has no position in any stocks mentioned.
