
 Yahoo Finance
 Investors Met With Slowing Returns on Capital At Optimax Holdings Berhad (KLSE:OPTIMAX)
If we want to find a stock that could multiply over the long term, what are the underlying trends we should look for? In a perfect world, we'd like to see a company investing more capital into its business and ideally the returns earned from that capital are also increasing. This shows us that it's a compounding machine, able to continually reinvest its earnings back into the business and generate higher returns. With that in mind, the ROCE of Optimax Holdings Berhad (KLSE:OPTIMAX) looks decent, right now, so lets see what the trend of returns can tell us.
Understanding Return On Capital Employed (ROCE)
If you haven't worked with ROCE before, it measures the 'return' (pre-tax profit) a company generates from capital employed in its business. The formula for this calculation on Optimax Holdings Berhad is:
Return on Capital Employed = Earnings Before Interest and Tax (EBIT) ÷ (Total Assets - Current Liabilities)
0.19 = RM21m ÷ (RM135m - RM22m) (Based on the trailing twelve months to March 2024).
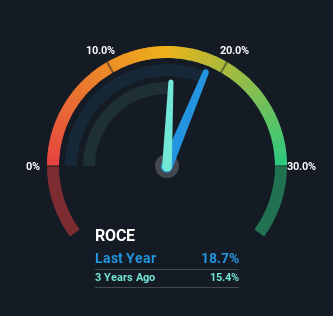
Thus, Optimax Holdings Berhad has an ROCE of 19%. On its own, that's a standard return, however it's much better than the 10% generated by the Healthcare industry.
View our latest analysis for Optimax Holdings Berhad
Above you can see how the current ROCE for Optimax Holdings Berhad compares to its prior returns on capital, but there's only so much you can tell from the past. If you're interested, you can view the analysts predictions in our free analyst report for Optimax Holdings Berhad .
What The Trend Of ROCE Can Tell Us
The trend of ROCE doesn't stand out much, but returns on a whole are decent. Over the past five years, ROCE has remained relatively flat at around 19% and the business has deployed 147% more capital into its operations. Since 19% is a moderate ROCE though, it's good to see a business can continue to reinvest at these decent rates of return. Stable returns in this ballpark can be unexciting, but if they can be maintained over the long run, they often provide nice rewards to shareholders.
Our Take On Optimax Holdings Berhad's ROCE
The main thing to remember is that Optimax Holdings Berhad has proven its ability to continually reinvest at respectable rates of return. And given the stock has only risen 6.3% over the last three years, we'd suspect the market is beginning to recognize these trends. That's why it could be worth your time looking into this stock further to discover if it has more traits of a multi-bagger.
Optimax Holdings Berhad does have some risks though, and we've spotted 2 warning signs for Optimax Holdings Berhad that you might be interested in.
While Optimax Holdings Berhad isn't earning the highest return, check out this free list of companies that are earning high returns on equity with solid balance sheets.
Have feedback on this article? Concerned about the content? Get in touch with us directly. Alternatively, email editorial-team (at) simplywallst.com.
This article by Simply Wall St is general in nature. We provide commentary based on historical data and analyst forecasts only using an unbiased methodology and our articles are not intended to be financial advice. It does not constitute a recommendation to buy or sell any stock, and does not take account of your objectives, or your financial situation. We aim to bring you long-term focused analysis driven by fundamental data. Note that our analysis may not factor in the latest price-sensitive company announcements or qualitative material. Simply Wall St has no position in any stocks mentioned.
Have feedback on this article? Concerned about the content? Get in touch with us directly. Alternatively, email editorial-team@simplywallst.com
