
 Yahoo Finance
 Some Investors May Be Worried About Trade Desk's (NASDAQ:TTD) Returns On Capital
If we want to find a stock that could multiply over the long term, what are the underlying trends we should look for? Typically, we'll want to notice a trend of growing return on capital employed (ROCE) and alongside that, an expanding base of capital employed. Ultimately, this demonstrates that it's a business that is reinvesting profits at increasing rates of return. However, after investigating Trade Desk (NASDAQ:TTD), we don't think it's current trends fit the mold of a multi-bagger.
Understanding Return On Capital Employed (ROCE)
Just to clarify if you're unsure, ROCE is a metric for evaluating how much pre-tax income (in percentage terms) a company earns on the capital invested in its business. Analysts use this formula to calculate it for Trade Desk:
Return on Capital Employed = Earnings Before Interest and Tax (EBIT) ÷ (Total Assets - Current Liabilities)
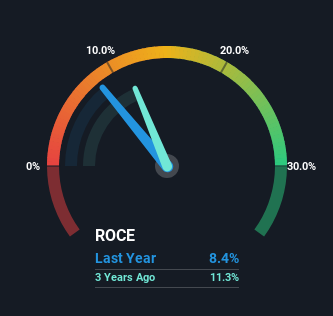
0.084 = US$200m ÷ (US$4.9b - US$2.5b) (Based on the trailing twelve months to December 2023).
Thus, Trade Desk has an ROCE of 8.4%. On its own that's a low return on capital but it's in line with the industry's average returns of 8.1%.
View our latest analysis for Trade Desk
In the above chart we have measured Trade Desk's prior ROCE against its prior performance, but the future is arguably more important. If you'd like, you can check out the forecasts from the analysts covering Trade Desk for free.
What Does the ROCE Trend For Trade Desk Tell Us?
In terms of Trade Desk's historical ROCE movements, the trend isn't fantastic. To be more specific, ROCE has fallen from 27% over the last five years. However, given capital employed and revenue have both increased it appears that the business is currently pursuing growth, at the consequence of short term returns. If these investments prove successful, this can bode very well for long term stock performance.
On a related note, Trade Desk has decreased its current liabilities to 51% of total assets. That could partly explain why the ROCE has dropped. What's more, this can reduce some aspects of risk to the business because now the company's suppliers or short-term creditors are funding less of its operations. Some would claim this reduces the business' efficiency at generating ROCE since it is now funding more of the operations with its own money. Keep in mind 51% is still pretty high, so those risks are still somewhat prevalent.
What We Can Learn From Trade Desk's ROCE
While returns have fallen for Trade Desk in recent times, we're encouraged to see that sales are growing and that the business is reinvesting in its operations. And the stock has done incredibly well with a 332% return over the last five years, so long term investors are no doubt ecstatic with that result. So while investors seem to be recognizing these promising trends, we would look further into this stock to make sure the other metrics justify the positive view.
If you're still interested in Trade Desk it's worth checking out our FREE intrinsic value approximation for TTD to see if it's trading at an attractive price in other respects.
While Trade Desk may not currently earn the highest returns, we've compiled a list of companies that currently earn more than 25% return on equity. Check out this free list here.
Have feedback on this article? Concerned about the content? Get in touch with us directly. Alternatively, email editorial-team (at) simplywallst.com.
This article by Simply Wall St is general in nature. We provide commentary based on historical data and analyst forecasts only using an unbiased methodology and our articles are not intended to be financial advice. It does not constitute a recommendation to buy or sell any stock, and does not take account of your objectives, or your financial situation. We aim to bring you long-term focused analysis driven by fundamental data. Note that our analysis may not factor in the latest price-sensitive company announcements or qualitative material. Simply Wall St has no position in any stocks mentioned.
